Laws, leaps in technology, and improved education have all proven to be our guardian angels on the road. Fewer Americans are dying in car crashes than ever before, and yet, there’s room for improvement when it comes to making our commutes even safer. We collected and examined data from the Insurance Institute for Highway Safety’s Highway Loss Data Institute to learn more about road safety in the past few decades.
Our analysis delves into how important factors like location, laws, and substance use can impact drivers and families across the country. Keep scrolling to learn more about how far the U.S. has come in terms of saving lives behind the wheel –plus how we could save even more in the future.
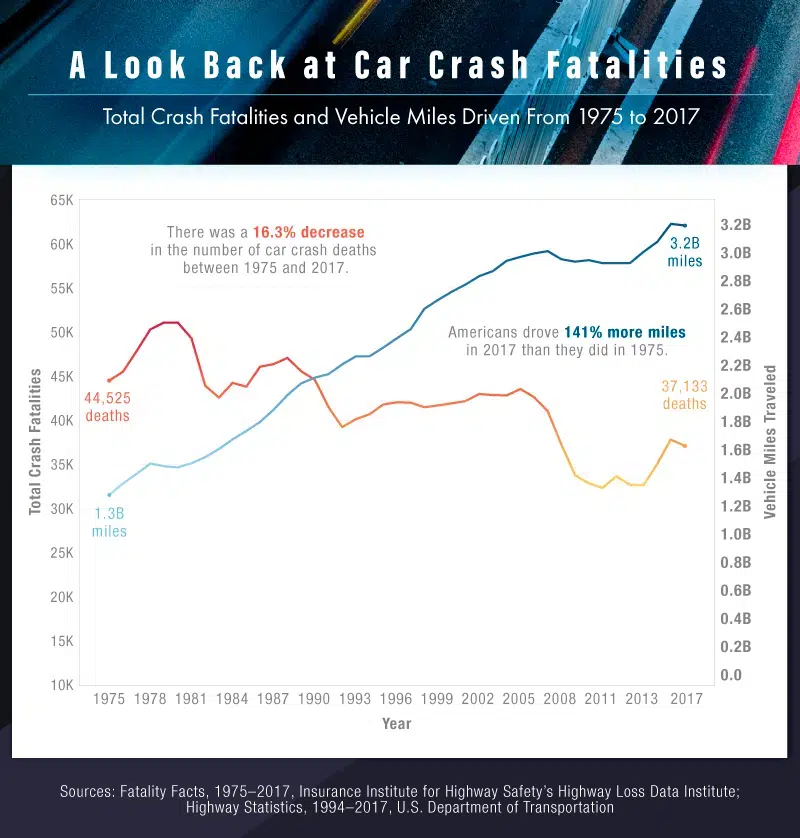
Longer Drives but Fewer Deaths
Today, there are more than 225 million licensed drivers in the U.S., according to the latest numbers, and on average, there are nearly two cars per household. Even in the era of ride-hailing services, electric scooters, and environmental concerns, Americans are driving longer distances than ever before.
Our analysis suggests that Americans drove 141 percent more miles in 2017 than in 1975 – yet, car accident deaths have declined. In 1975, 44,525 motor vehicle deaths were reported, compared to 37,133 reported in 2017. That’s a 16.3 percent decrease.
A New Era of Safety
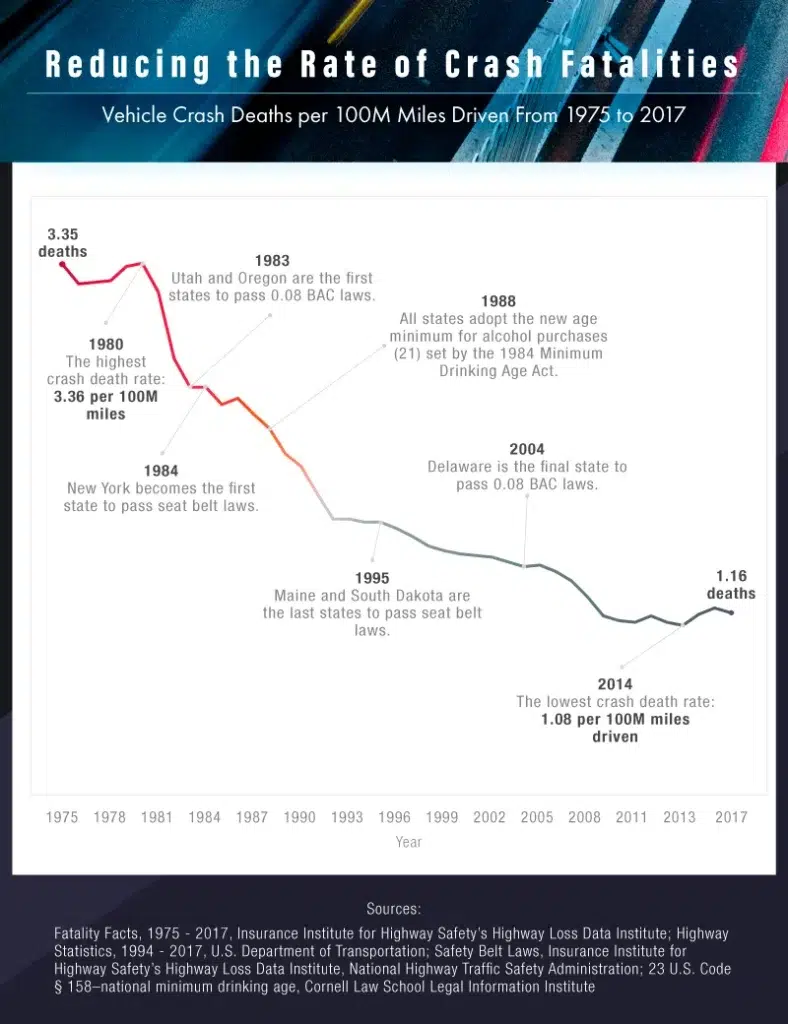
Fewer Americans are dying in car accidents than ever before – but why? It’s no miracle in the making, but rather an increasing stack of safety laws that have proven themselves effective. Here’s a brief overview of how history has changed our relationship with the roads.
1980 was an entirely different time for the United States. The U.S. government struggled to resolve the Iran hostage crisis. Mt. St. Helens erupted, spewing lava and ash and forcing thousands to evacuate. Beatles star John Lennon was shot and killed outside of his home in New York. Meanwhile, on America’s roads, thousands died in car accidents: 3.36 people died per 100 million miles, the highest crash death rate between 1975 and 2017. Shortly after, a few progressive laws slowly drove those numbers down.
In 1983, Utah and Oregon became the first states to pass a 0.08 blood alcohol content standard into law (before then, the standard was 0.10). In 1984, New York passed seat belt laws requiring car passengers and drivers to buckle up. Four years later, all states changed the age to purchase alcohol to 21 set by the 1984 Minimum Drinking Age Act. At this point, car accident deaths were already beginning their steep decline.
Then, in 2004, Delaware became the last state to pass a 0.08 blood alcohol content law (alcohol was involved in 28 percent of all traffic-related deaths in 2016, so imagine what it was like before the 0.08 standard was established). In 2014, Americans saw the lowest crash death rate ever:1.08 people per 100 million miles driven.
Today, laws are still being put in place to help improve our roads and match developing technology trends: 47 states have banned texting while driving, and 16 states prohibit any hand-held phone use at the wheel.
Leading Locations
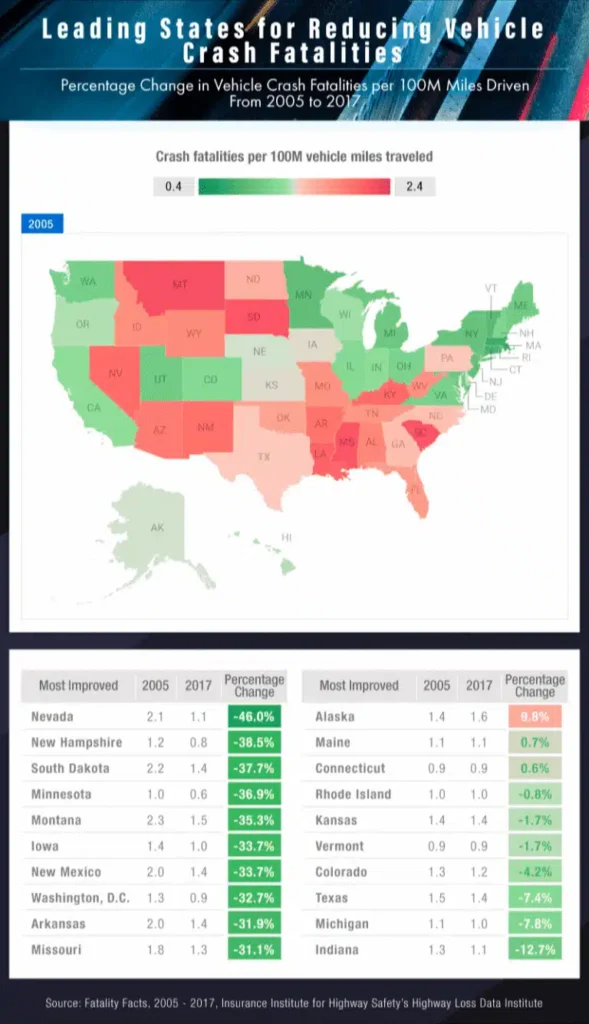
Although fatal car crashes have been on a decline nationwide, some states have shown more progress than others. We analyzed the number of crash fatalities in all states from 2005 to 2017 to see which regions are most aggressively tackling car fatalities today. Nevada, New Hampshire, South Dakota, Minnesota, and Montana were the most-improved states in this 12-year period.
Nevada managed to decrease its car accident fatalities per 100 million miles driven by 46 percent during this time, followed by New Hampshire at 38.5 percent and South Dakota at 37.7 percent. It’s unclear why Nevada leads the pack, but the state is showing it’s proactive about car safety. In 2017, state senators attempted to pass more legislation to protect child passengers, in particular. However, Senate Bill 156 died before it was approved.
As for the least improved states, Alaska showed a 9.8 percent increase in car accident deaths per 100 million miles driven. Maine had a very small increase of 0.7 percent, as well as Connecticut at 0.6 percent. There’s no definitive cause for Alaska’s recent uptick, but some have speculated that falling gas prices may have encouraged more people to hit the roads during this period.
Buckle Up
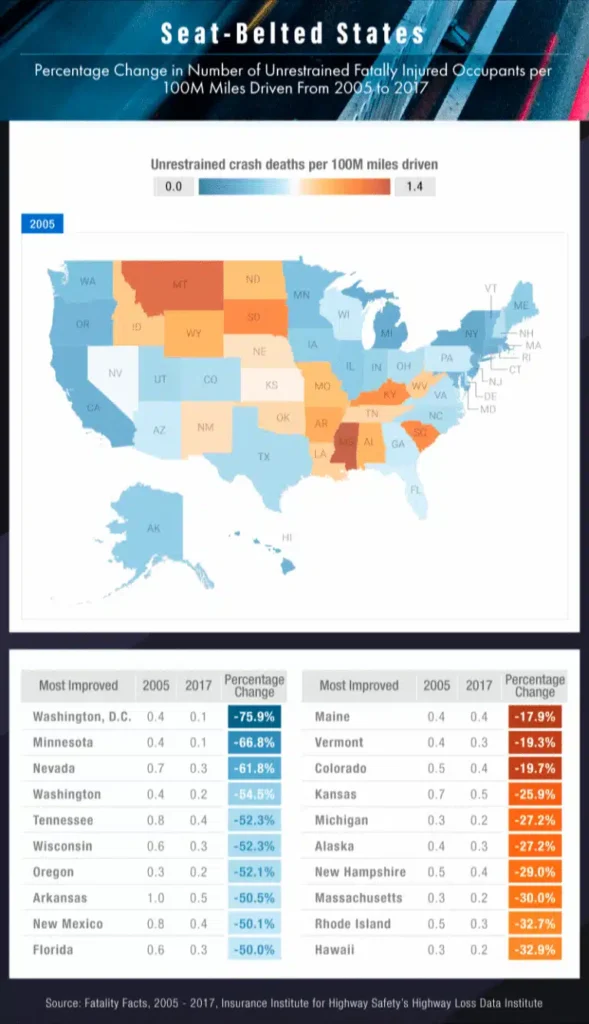
The U.S. government has spent years campaigning for drivers and passengers to wear a seat belt, often with catchy slogans like “buckle up” and “click it or ticket.” After all, there’s plenty of incentive to wear a seat belt – doing so can reduce the risk of fatal injury by 45 percent, according to the U.S. Department of Transportation.
Thankfully, some regions of the U.S. showed standout reductions in unrestrained car accident deaths between 2005 and 2017. Our analysis suggests the most-improved areas for improper seat belt-related deaths were Washington, D.C., Minnesota, Nevada, Washington, Wisconsin, and Tennessee. These states showed more than a 50 percent reduction in unrestrained car accident deaths, with Washington, D.C. showing a nearly 76 percent reduction.
Meanwhile, Maine, Vermont, Colorado, Kansas, Alaska, and Michigan showed the least improvement. Although Maine – the least improved state – still saw a nearly 18 percent reduction in car accident deaths resulting from improper seat belt use, it’s clear the state simply isn’t making as stellar of an impact as others. Interestingly, some states require riders aged 18 and over to wear a seat belt and considers a violation of this a primary offense. Michigan and Kansas also consider a violation of their safety belt laws a primary offense.
Future of Fatalities
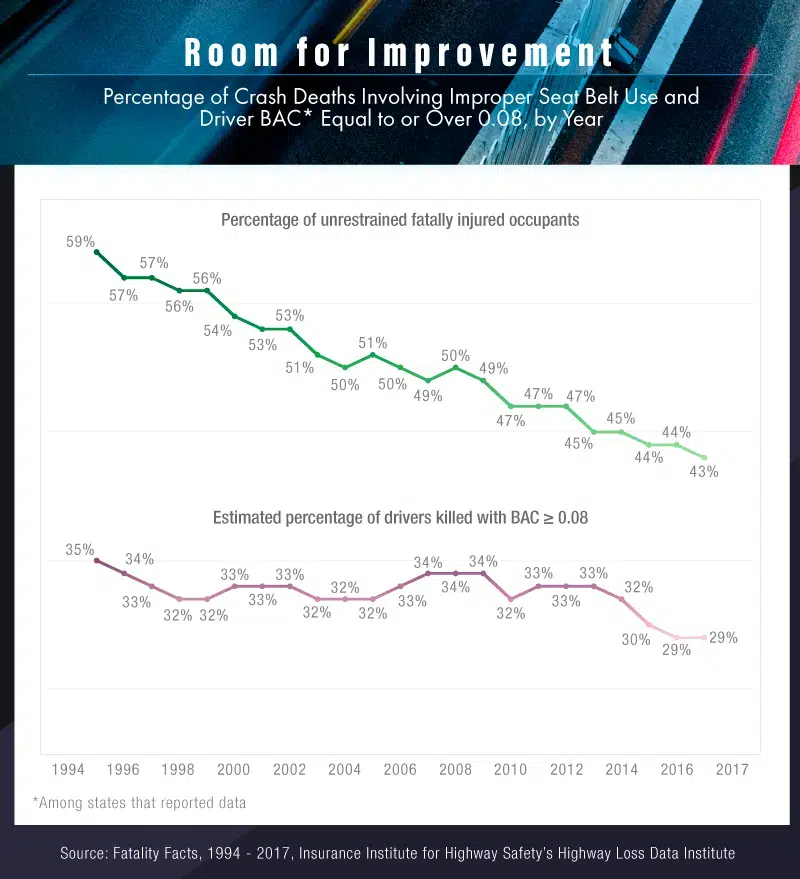
Despite the progress that’s been made in driving safety nationwide, driving with a blood alcohol content above the legal limit and improper seat belt use can still result in accident-related deaths. Our analysis indicates that the percentage of fatally injured unrestrained occupants decreased from 59 percent in 1995 to 43 percent in 2017. Although this shows great improvement, it also suggests Americans are still not consistently buckling up.
During the same period, however, fatal accidents related to high blood alcohol content declined less dramatically. In 1995, an estimated 35 percent of drivers killed in crashes had a BAC equal to or over 0.08. The most recent figure shows a 6 percentage point decrease to an estimated 29 percent of drivers killed. Still, nearly 1 in 3 drivers killed had a blood alcohol content that was over the legal limit.
You might wonder what states are doing now to reduce drunk driving deaths. At the beginning of 2019, California joined other states in requiring those convicted for drunk driving to install breathalyzers in their vehicles, preventing them from starting the car if their BAC is above the legal limit. Research has shown these machines prevented more than 2 million cars from starting over a 10-year period. At the end of 2018, Utah also became the first state to lower its legal BAC limit to 0.05, the lowest in the nation.
More Work to Be Done
The Centers for Disease Control and Prevention states that driving with a blood alcohol content over the legal limit can lead to impaired perception of danger, poor muscle coordination, impaired self-control and judgment, short-term memory loss, and a lack of speed control on the road. In other words, it’s a grave danger, and it costs many lives – 17 percent of traffic deaths among children aged 0 to 14 involved an alcohol-impaired driver, for instance.
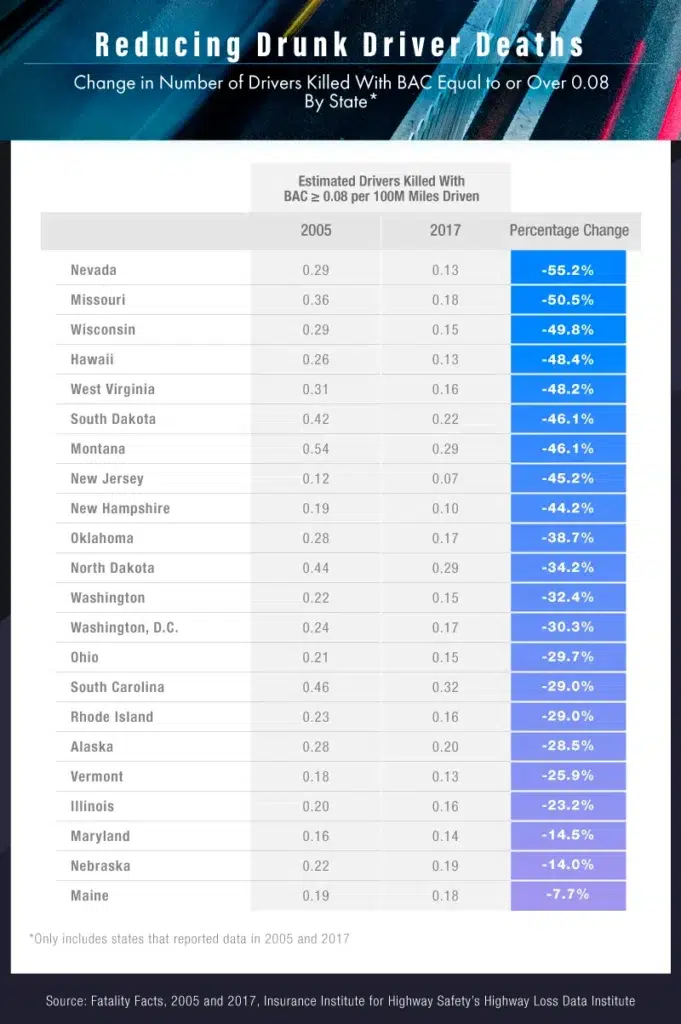
The following table shows the percentage change in driver deaths involving a BAC equal to or over 0.08 and per every 100 million miles driven (please note the table only includes states that reported their data in 2005 and 2017). Nevada led the way, having reduced its alcohol-related driver deaths by 55.2 percent, followed by Missouri and Wisconsin. Maine, Nebraska, and Maryland saw the smallest decrease during this period, although a decrease nevertheless.
Live, Learn, and Protect Yourself
Americans are driving more than ever, with the number of miles driven rising by over 141 percent since 1975. For that reason, it’s important to understand how we can better protect ourselves on the road. Our analysis of government data has revealed key insights into the overall downtrend in car accident deaths, as well as identified regions that are still susceptible to hazardous behaviors while driving. Together, we can use this understanding to better avoid these tragedies on the road.
At Farah & Farah, we’re committed to protecting you and your family. We care about protecting Florida car accident victims, whether that’s helping them get another vehicle, paying their medical bills, or ensuring they return to work. After a devastating car wreck, we’re all about getting our clients’ lives back to normal – and we can do that for you, too. Please visit our website or contact us to get in touch.
Methodology
For a majority of this analysis, we collected data from the U.S. Department of Transportation’s Fatality Analysis Reporting System (FARS) via the Insurance Institute for Highway Safety’s Highway Loss Data Institute. For 2005 to 2017, we used their data from the Fatal Crash Totals, Alcohol Involvement, and Restraint Use state-by-state overview tables. We also used the following yearly snapshot tables:
- Motor vehicle crash deaths per 100 million miles traveled, 1975–2017
- Seat belt use among fatally injured passenger vehicle occupants 13 and older by seating position, 1995–2017
Additional data for vehicle miles driven annually came from the U.S. Department of Transportation’s yearly report, Highway Statistics Series. We summed the total number of vehicle miles of travel by functional system for each year from 1994 to 2017.
We calculated the number of unrestrained occupant deaths per 100 million miles driven and the number of drivers killed with BAC ≥ 0.08. For each state, we divided the estimated number of drivers killed with BACs ≥ 0.08 by the total vehicle miles driven and multiplied by 100. The same was done with the number of unrestrained occupants killed in crashes. This was done with data from 2005 and 2017. A similar calculation was used to find the total deaths per 100 million vehicle miles traveled for 1975 to 2004.
Limitations
Although seat belt and BAC laws have played an influential role in reducing the number of car crash fatalities, many other factors have influenced the safety of our roads, such as speed limits, improved driver education requirements, improved automobile technology, etc.
Not all states reported the number of drivers killed with a BAC greater than or equal to 0.08 in both 2005 and 2017. If they had, we might have had additional or different insights about drunk driver fatalities.
Sources
- https://one.nhtsa.gov/people/injury/research/pub/alcohol-laws/08history/1_introduction.htm
- https://www.law.cornell.edu/uscode/text/23/158
- https://www.iihs.org/research-areas/seat-belts
- https://www.iihs.org/research-areas/fatality-statistics/detail/state-by-state
- https://www.iihs.org/research-areas/fatality-statistics/detail/yearly-snapshot
- https://www.fhwa.dot.gov/policyinformation/statistics.cfm
- https://www.iihs.org/research-areas/fatality-statistics/detail/yearly-snapshot
- https://www.fhwa.dot.gov/policyinformation/statistics/2017/dl20.cfm
- https://www.autonews.com/article/20180123/MOBILITY/180129900/study-shows-rise-in-u-s-vehicle-ownership-per-person-household/
- https://www.sciencing.com/effects-car-pollutants-environment-23581/
- https://www.politico.com/story/2017/04/23/iranian-rescue-mission-ends-in-debacle-april-24-1980-237422
- https://www.thoughtco.com/mt-st-helens-1779771
- https://www.rollingstone.com/music/music-news/john-lennons-killer-mark-david-chapman-shame-757134/
- https://one.nhtsa.gov/people/injury/research/pub/alcohol-laws/08history/1_introduction.htm
- https://www.npr.org/transcripts/679833767
- https://alcoholpolicy.niaaa.nih.gov/the-1984-national-minimum-drinking-age-act
- https://www.insurancejournal.com/magazines/mag-features/2004/07/05/44093.htm
- https://www.ncsl.org/transportation/distracted-driving-cellphone-use
- https://www.reviewjournal.com/news/2017-legislature/not-everyone-pleased-with-proposal-for-stricter-car-seat-laws/
- https://www.adn.com/alaska-news/2016/11/24/alaska-traffic-fatalities-up-sharply-so-far-in-2016/
- https://www.trafficsafetymarketing.gov/get-materials/seat-belts/buckle
- https://www.ghsa.org/state-laws/issues/seat%20belts
- https://abcnews.com/Health/states-breathalyze-convicted-drunk-drivers-reduce-fatalities/story?id=60192513
- https://www.usatoday.com/story/news/2018/12/19/utah-lower-drunk-driving-limit-05-other-states/2358649002/
Fair Use Statement
Interested in sharing our findings on the decrease in car crash fatalities? You are welcome to share for noncommercial purposes as long as you include a link to this page and give credit where it’s due.