Tampa consistently ranks among the more dangerous cities for drivers, with crash data showing a high number of accidents, injuries, and fatalities each year. These Tampa car accident statistics provide a closer look at how often crashes occur and where the greatest risks exist across the area.
Examining local and statewide data makes it easier to identify patterns in driver behavior, roadway conditions, and accident frequency. This information plays an important role in understanding road safety trends and how they continue to affect drivers throughout Hillsborough County.
Table of Contents
Tampa Car Accident Trends Over Recent Years
Tampa Car Accident Injury and Fatality Data
What Are the Leading Causes of Car Accidents in Tampa?
What Types of Car Accidents Are Most Common in Tampa?
When Do Car Accidents Happen Most Often in Tampa?
Where Are Car Accidents Most Likely to Occur in Tampa?
Car Accident Statistics by Age Group
What Percentage of Tampa Car Accidents Are Hit and Run?
DUI and Distracted Driving Accident Statistics in Tampa
Motorcycle Accident Statistics in Tampa
Tampa Car Accident Trends Over Recent Years
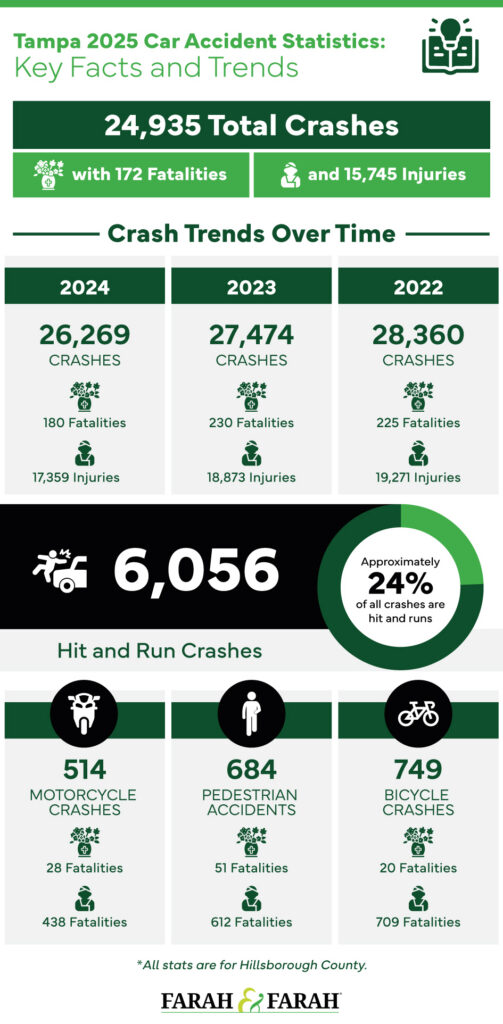
Tampa car accident statistics show that crashes remain frequent across Hillsborough County, even as totals have declined slightly in recent years. In 2025, there were 24,935 total crashes, 15,745 injuries, and 172 fatalities reported.
Over the previous few years, crash totals have gradually decreased, from 28,360 in 2022 and 27,474 in 2023 to 26,269 crashes in 2024. While this downward trend suggests some improvement, the overall number of crashes in Tampa remains high.
Across Florida, crash activity is also significant. In 2024, the state averaged approximately 1,799 crashes per day, reflecting the frequency of accidents across the state. Local data in Tampa follows a similar pattern of frequent daily collisions.
Tampa Car Accident Injury and Fatality Data
Tampa car accident injury statistics show that a large number of crashes result in injuries each year. In 2025, Hillsborough County reported 15,745 injuries and 172 fatalities from car accidents.
Injuries account for the majority of reported outcomes, while fatalities represent a smaller but consistent portion of total crashes. Pedestrian crashes accounted for the highest number of fatalities at 51, followed by motorcycle crashes with 28 fatalities and bicycle crashes with 20 fatalities.
Severe injuries are also common among vulnerable road users, with pedestrian crashes resulting in 612 injuries, bicycle crashes in 709 injuries, and motorcycle crashes in 438 injuries.
What Are the Leading Causes of Car Accidents in Tampa?
Crash data in Tampa shows that most crashes are caused by driver behavior rather than external conditions. Data from Florida crash reports identifies several common causes behind collisions each year.
The leading cause of crashes is careless or negligent driving, which accounted for 264,630 crashes statewide in 2024. Failing to yield the right of way was the second most common cause, contributing to 162,616 crashes.
Other frequently reported causes include:
- Speeding contributed to 16,276 crashes, reducing reaction time and increasing crash severity.
- Running red lights accounted for 32,071 crashes, often leading to serious intersection collisions.
- Running stop signs was responsible for 19,198 crashes, frequently involving failure to yield.
- Following too closely resulted in 69,126 crashes, making rear-end collisions among the most common types of crashes.
What Types of Car Accidents Are Most Common in Tampa?
Car accidents in Tampa take many forms, each with unique circumstances and contributing factors. Common types of car accidents reported in Tampa include the following:
- Rear-end collisions: Often caused by following too closely or sudden stops, these are among the most frequently reported crashes.
- Side-impact collisions: Also known as T-bone accidents, these typically occur at intersections when a driver fails to yield or runs a red light.
- Head-on collisions: High-impact crashes that often result in severe or fatal injuries due to the force of opposing vehicles.
- Multi-vehicle accidents: Involve three or more vehicles and can make determining fault more complex.
- Hit-and-run accidents: Occur when a driver leaves the scene without providing information or assistance.
Single-vehicle accidents: These may involve collisions with fixed objects and are often linked to speeding, impairment, or loss of control.
When Do Car Accidents Happen Most Often in Tampa?
Car accident patterns in Tampa often follow broader trends seen across Florida, with certain times, days, and conditions showing higher crash activity.
In 2024, the highest number of crashes in Florida occurred on Fridays, with 154,836 total crashes reported. By comparison, Sundays had the fewest crashes at 101,609.
Time of day also plays a role. Most crashes occurred during daylight hours, with 650,295 crashes reported statewide. Clear weather and dry road conditions were also associated with the highest number of crashes, with 750,879 crashes in clear weather and 817,878 crashes on dry roads.
These patterns suggest that higher traffic volume, rather than poor weather conditions, is a major factor in crash frequency. Busy travel times, commuting hours, and increased road use at the end of the workweek can all contribute to higher accident rates.
Where Are Car Accidents Most Likely To Occur in Tampa?
Car accidents in Tampa are more likely to occur in areas with heavy traffic, frequent stops, and complex roadway design.
Common higher-risk areas include the following:
- Major highways and interstates: Roads such as I-275 and I-4 carry large volumes of traffic and account for 94,520 crashes in Florida in 2024, often involving higher-speed collisions.
- Urban intersections: Busy intersections with multiple lanes, turning traffic, and signal changes can increase the likelihood of crashes.
- State roads: The second-highest number of crashes occurs on state roads, with 188,679 reported statewide.
- Local roads: Across Florida, the highest number of crashes occurs on local roads, with 308,685 reported in 2024.
Local roads account for the highest number of crashes, largely due to frequent stops, turning movements, and close interaction between vehicles, pedestrians, and cyclists. These conditions increase the likelihood of collisions compared to roadways with more controlled traffic flow.
Car Accident Statistics by Age Group
Car accident statistics show that younger drivers are involved in more crashes than older drivers. Across Florida, drivers aged 20 to 24 were involved in 69,048 crashes in 2024, making them the most represented age group in reported accidents.
Crash involvement tends to decrease with age, as older drivers are generally involved in fewer total collisions. Younger drivers may face higher crash rates due to factors such as inexperience, risk-taking behaviors, and increased time spent on the road.
What Percentage of Tampa Car Accidents Are Hit and Run?
Hit-and-run crashes account for a significant share of reported accidents in Tampa. These incidents occur when a driver leaves the scene without providing information or assistance after a crash.
In 2025, Hillsborough County reported 6,056 hit-and-run crashes out of 24,935 total crashes. This means approximately 24 percent of all crashes involved a hit-and-run.
Even without immediate accountability, these crashes can still result in serious outcomes. In 2025, hit and run accidents led to 9 fatalities and 1,404 injuries in Hillsborough County.
DUI and Distracted Driving Accident Statistics in Tampa
Crashes involving impaired or inattentive drivers remain a consistent factor in Tampa crash data. These types of accidents are often associated with more severe outcomes due to reduced reaction time and impaired decision-making.
In 2025, Hillsborough County reported 403 alcohol-related crashes, resulting in 19 fatalities and 184 injuries. These incidents reflect the ongoing impact of drunk driving on Tampa roadway safety.
Drug-related crashes were also reported, with 31 crashes leading to 19 fatalities and 29 injuries. Although fewer in number, these crashes accounted for a disproportionate share of fatal outcomes.
Distracted driving is another major contributing factor. In Florida, there were 148,518 distracted-driving crashes in 2024, accounting for a significant share of the total across the state.
Motorcycle Accident Statistics in Tampa
In 2025, Hillsborough County reported 514 motorcycle crashes, resulting in 28 fatalities and 438 injuries. While these crashes make up a limited portion of total accidents, they account for a higher proportion of serious and fatal outcomes compared to other vehicle types.
In Tampa motorcycle accidents, riders are more exposed to impacts with other vehicles or roadway surfaces. As a result, injuries are more likely to be severe, even those sustained in crashes at lower speeds. This increased vulnerability contributes to the higher incidence of fatalities relative to the total number of motorcycle crashes.
Pedestrian and Bicycle Accident Statistics in Tampa
Pedestrians and cyclists are particularly vulnerable in traffic accidents, which can lead to more serious injuries.
In 2025, Hillsborough County reported 684 pedestrian accidents, resulting in 51 fatalities and 612 injuries. Bicycle crashes were also significant, with 749 crashes, 20 fatalities, and 709 injuries reported.
A pedestrian accident in Tampa often involves direct impact with a vehicle, which can increase the likelihood of severe or fatal injuries. Bicycle crashes similarly involve limited protection, especially in areas with heavy traffic or limited dedicated bike lanes.
Get Help With a Tampa Car Accident Claim
If you have been injured in a crash, understanding Tampa car accident statistics is only one part of the process. Knowing your legal options can help you take the next steps after an accident.
A Tampa car accident lawyer at Farah & Farah can help you evaluate your situation, explain your rights, and handle the claims process while you focus on recovery. Our team works to protect your interests and pursue compensation based on the specific details of your case.
Call (877) 245-6707 or contact us online for a free consultation and learn how our team can assist you.