Which personal or contextual factors might fuel the search for retribution on the road? We decided to explore this question, surveying more than 1,000 individuals about their own aggressive driving habits. We then analyzed their demographic characteristics and assessed their personality traits to explore which people might be most inclined to road rage. Our findings provide compelling insight into seemingly inexplicable episodes of aggression on the road. To discover the traits that define America’s road ragers, keep reading.
Aggression on the Road: Perception and Practice
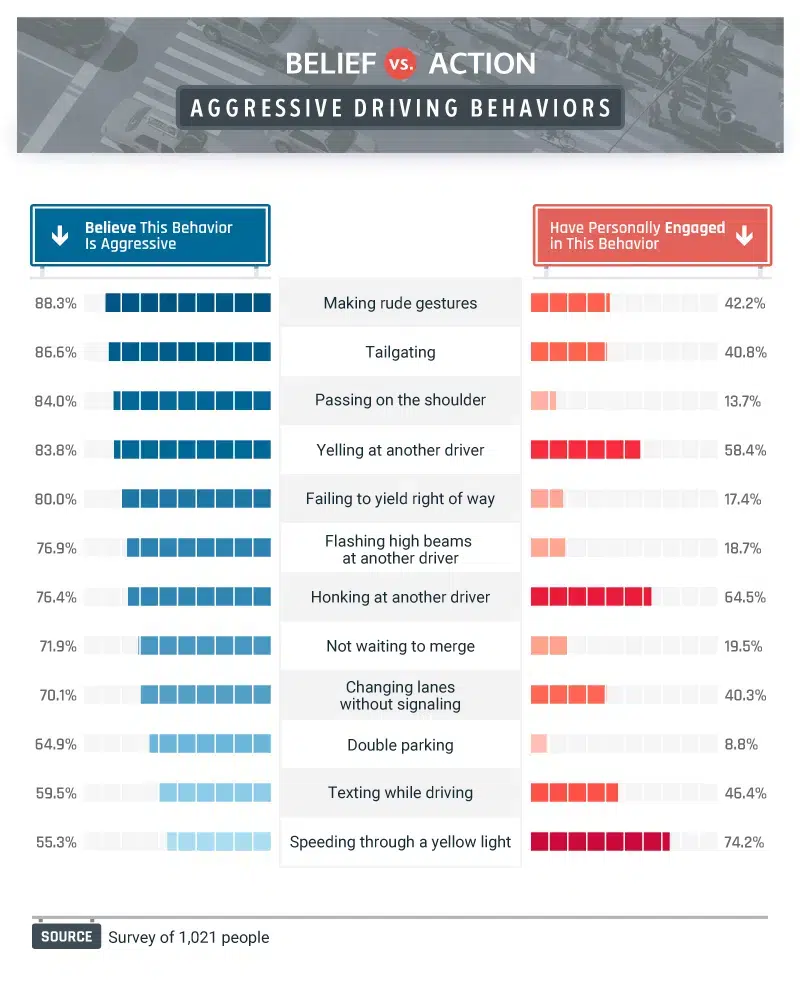
In analyzing the nature of road rage reactions, we first assessed which offensive or threatening maneuvers our respondents performed most frequently, and which they were most likely to regard as aggressive. In some cases, exceedingly common infractions were rated among the least aggressive: Roughly three-quarters of respondents admitted to speeding through yellow lights on occasion, and merely 55 percent qualified it as an aggressive driving action. In other cases, however, the opposite held true. Although just 65 percent regarded double parking as aggressive, for example, fewer than 1 in 10 respondents said they’d done it.
Making rude gestures was the move most widely regarded as aggressive, and just 42 percent said they’d committed this offense before. Interestingly, respondents were more likely to yell at other drivers and less likely to regard doing so as aggressive. Perhaps people feel that other drivers are unlikely to hear them, so their shouts are a more private expression of frustration than raising the middle finger. Sometimes, however, making one’s displeasure known is precisely the point: Nearly two-thirds of respondents admitted to honking at other drivers.
Demographics of Driving Dangerously
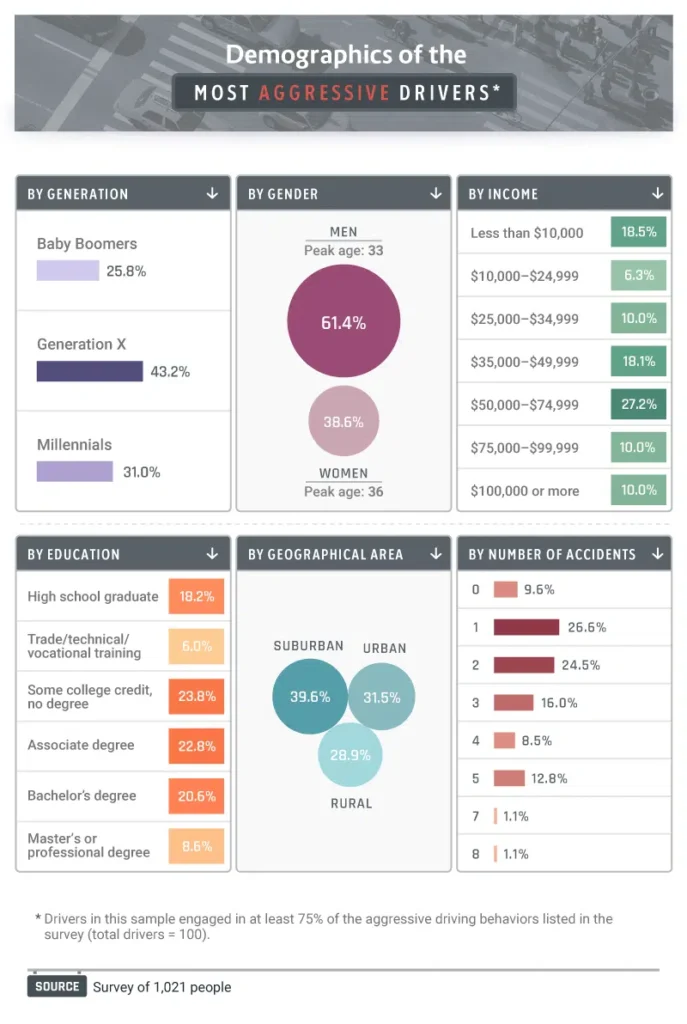
From among all our respondents, we identified the most aggressive contingent of drivers and studied their demographic composition. Interestingly, Gen Xers represented a larger portion of this cohort than millennials, despite prior studies suggesting millennials are most likely to practice a range of poor driving behaviors. The overrepresentation of men among aggressive drivers was less surprising, however. Male drivers account for millions more accidents annually than their female peers, likely because they’re more inclined to take risks on the road.
No consistent correlation emerged between aggressive driving and increased income, although individuals who made between $50,000 and $74,999 represented 27 percent of the aggressive driving group. Similarly, educational attainment didn’t seem to prevent aggressive driving, with high school grads and those with bachelor’s degrees about equally represented. In terms of past accident experience, however, aggressive drivers were most likely to have just one or two crashes on their record, rather than three or more. Perhaps after experiencing multiple accidents, one’s appetite for aggression declines. It is important to note, however, that our study asked only for total number of driving accidents and does not account for which driver was at fault.
Accidents, Impulsivity, and Aggression: Problems of Personality?
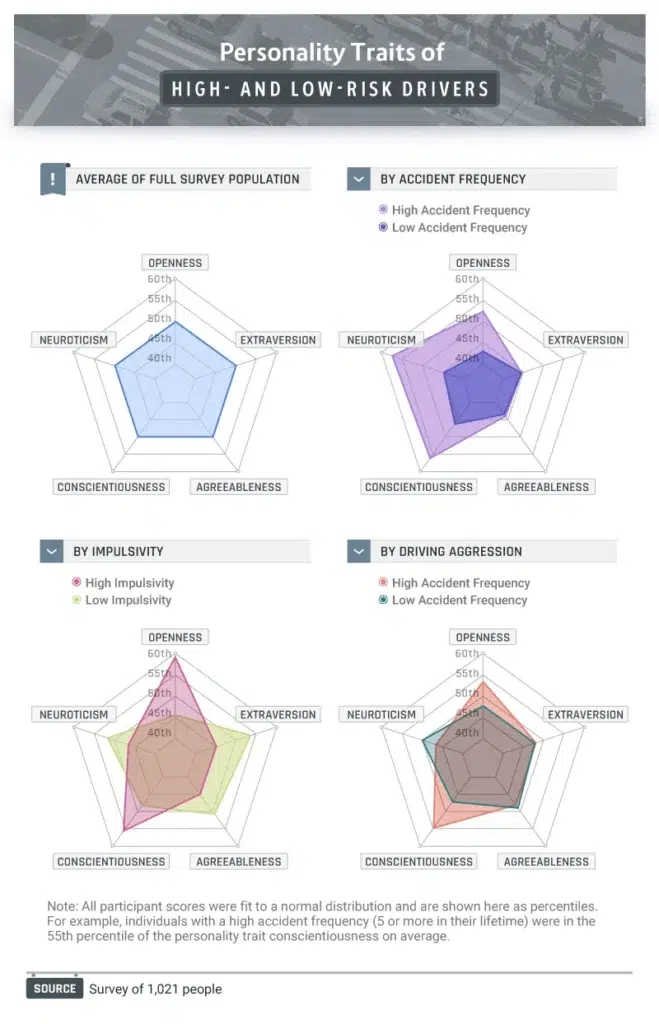
Moving beyond demographic segmentation, we sought to study the psychological traits of those who demonstrate dangerous driving behaviors. To do so, we administered the “Big Five” personality trait test to our participants, asking them to answer a number of questions about their preferences and attitudes. This widely renowned tool draws its name from the five personality variables it measures:
Openness to experience
How much a person is intellectually curious, creative, or interested in new and unfamiliar experiences. Openness to experience is correlated with many positive outcomes, such as intelligence and creativity.
Conscientiousness
How organized, discipline, organized, and generally reliable an individual is; at high levels, conscientiousness has also been associated with stubbornness and rigidity.
Extraversion
Relates to an individual’s assertiveness, comfort in groups, and general preference for solitude and reflection versus being more stimulated by the company of others.
Agreeableness
Relates to an individual’s levels of compassion and ability to cooperate, and also is correlated with overall temperament and disposition.
Neuroticism
The trait most directly related to an individual’s response to stress, as well as how one exhibits anger, anxiety, and the overall spectrum of emotions.
When we averaged the results for all of our respondents, we found we had a relatively typical cohort, with each variable represented approximately equally. Yet, when we drew distinctions on the basis of driving behaviors and attitudes, compelling differences emerged. Those who had a large number of accidents, for example, registered significantly higher levels of openness, neuroticism, and conscientiousness. Highly aggressive drivers were more inclined to openness and conscientiousness as well, relative to peers with few aggressive driving habits.
Openness to experience might seem to logically align with aggressive driving: Those who take risks in other aspects of their lives might also make some ill-advised moves on the road. The connection with conscientiousness might seem harder to fathom, but those who possess high levels of this trait are often rigid about planning and scheduling. When traffic threatens to make them late, they could drive perilously to arrive on time. Additionally, we gauged our respondents’ levels of impulsivity using a separate set of personality questions.
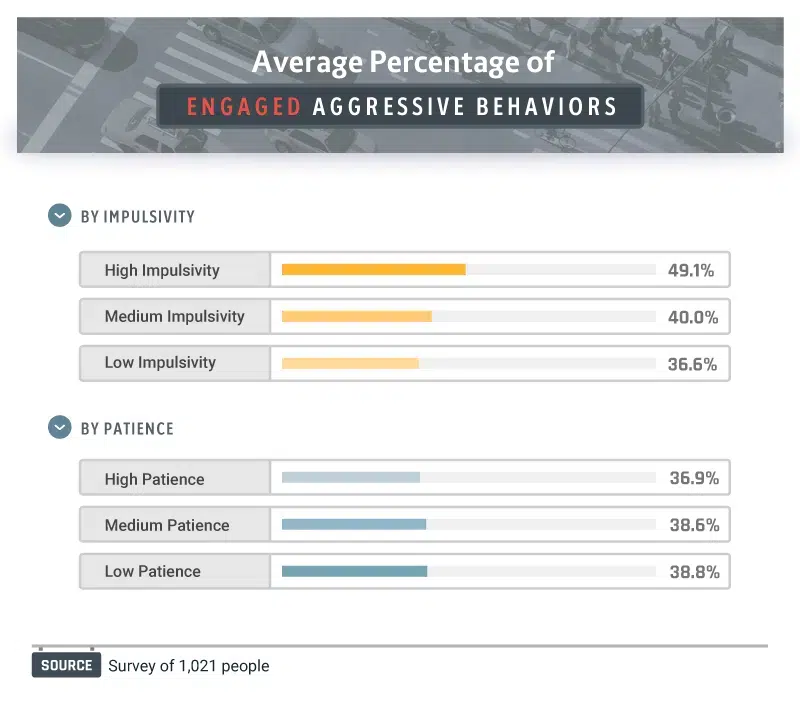
In addition to assessing the “Big Five” personality metrics of our respondents and the extent of their impulsivity, we studied the degree of patience they possessed using yet another survey tool. We asked people to rate their own levels of patience and impulsivity in general, not just while on the road, and found that only higher levels of impulsivity seemed to have an impact on driving aggression. This could perhaps partially be due to the fact that, while having high vs. low patience may not necessarily manifest in someone’s action, impulsivity more directly relates to behavior. For people unable to summon serenity while driving, however, working on patience may still be a place to start: Many experts regard patience as a skill, rather than an innate characteristic. Mindfulness techniques, for example, can help individuals reduce stress and practice greater restraint – improvements with real safety implications in the context of driving.
Aggressive Automobiles?
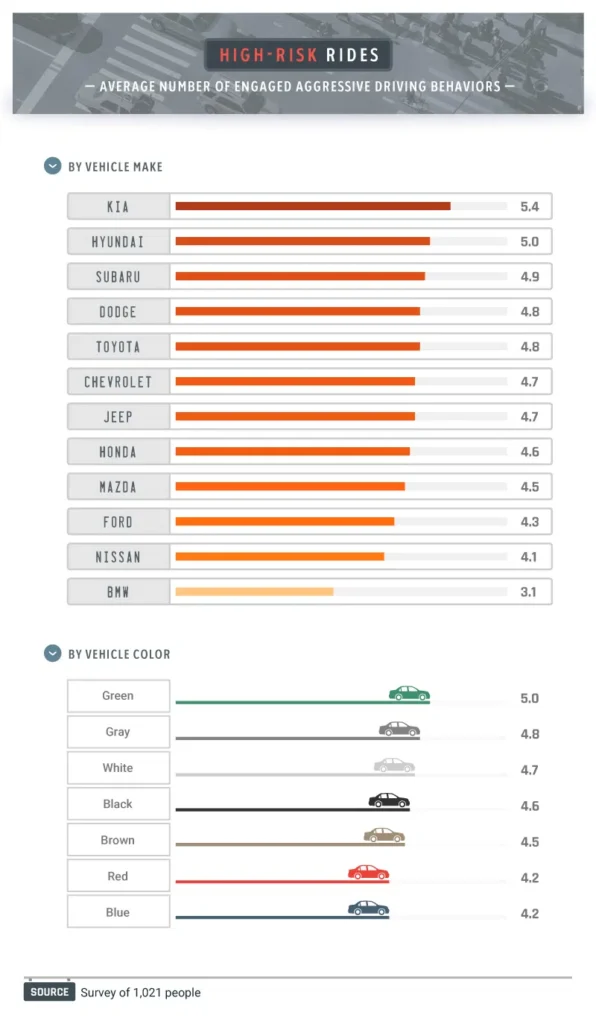
Luxury vehicles are sometimes associated with uncourteous driving; some studies suggest that those who own costlier cars are more likely to drive selfishly. Yet, when we analyzed individuals’ aggressive driving habits by the cars they drove, precisely the opposite proved true. BMW drivers had the fewest aggressive driving habits on average, despite the automaker’s reputation for packing horsepower beneath the hood. Conversely, those who owned more affordable brands seemed more inclined to drive aggressively. KIA and Hyundai drivers, for example, had at least five aggressive tendencies on average.
Some car colors are linked in the public mind with bold driving (we’ve all heard the popular myth that red automobiles cost more to insure). But our data indicate that people behind the wheels of green vehicles were actually most likely to drive aggressively. Otherwise, those with cars in distinctive shades actually tended to be mild drivers. Red and blue car owners had the fewest aggressive driving habits on average.
Crash Record Comparisons
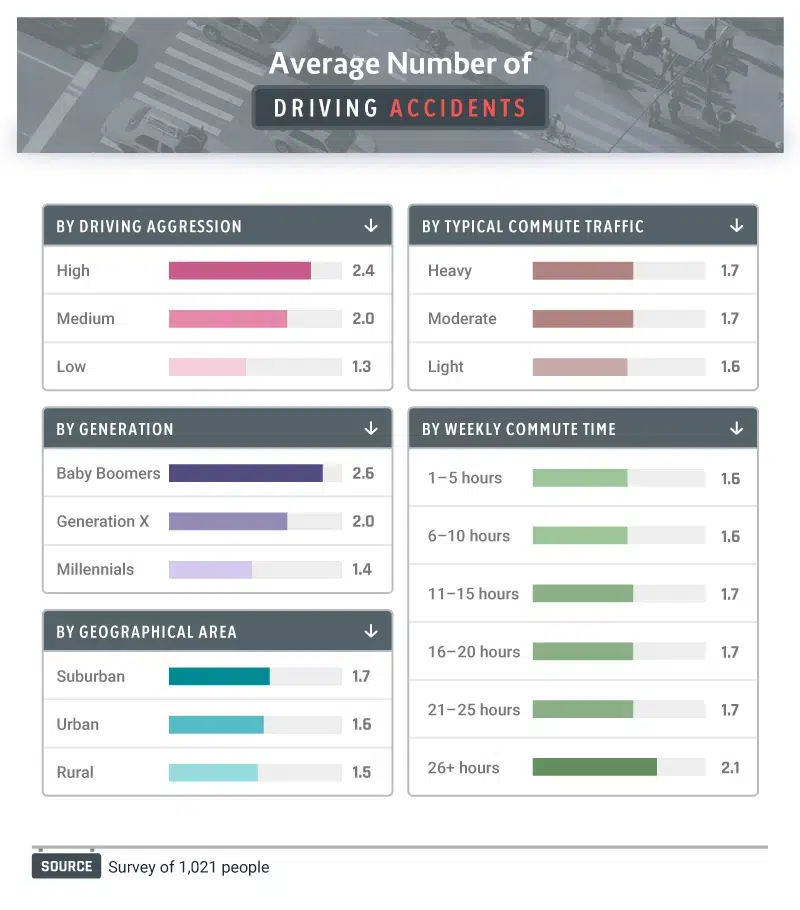
While aggressive driving presents the possibility of danger, we also looked for demographic and psychographic patterns in our respondents’ actual accident records. Angry driving does have its consequences: Elevated levels of aggression correlated with a greater number of accidents on average. In fact, high-aggression drivers had nearly twice as many accidents, statistically, as low-aggression individuals.


Baby boomers had the greatest number of accidents, on average, but that finding could simply reflect decades spent driving. Similarly, those who commuted more than 25 hours a week had the most crashes, but the substantial amount of time they spend driving obviously increases their accident risk. The geographical area and traffic along their typical commute seemed to exert little influence on our respondents’ accident histories. As far as averting accidents, our behaviors behind the wheel seem to matter more than the context in which we drive.
Protection Against the Aggression of Others

Our results indicate significant correlations between certain traits and aggressive driving tendencies. But putting aside demographic or psychographic distinctions, our findings serve to remind us all to practice a greater degree of patience behind the wheel. Even when other drivers are obviously at fault, you stand to gain little by responding aggressively. You might even incite a larger incident in which someone is seriously hurt. In some ways, putting responsibility above retribution is the most important choice you can make to defend yourself and your family when others are driving dangerously.
If an accident does take place, of course, you’re entitled to explore all avenues of recourse afforded by the law. In the days that follow a crash, pain and financial pressures can leave injured persons overwhelmed. These circumstances call for attentive assistance and unparalleled expertise. With the Farah & Farah team by your side during these trying times, you’ll have the support necessary to evaluate your options and proceed with confidence.
Methodology
This campaign surveyed 1,105 Americans with valid driver’s licenses whose primary form of transportation was a motor vehicle. The sample included 537 men, 476 women, and two respondents not identifying as male or female. The median age of the sample was 33 years old. Participants were asked to identify how many of 12 aggressive driving behaviors they’d engaged in as a means to assess aggressive driving. A “highly aggressive” driver was considered any driver who had engaged in nine (75%) or more of the behaviors. Impatience was evaluated using the “Ultra Short” measures described in Vischer et al. (2012), and impulsiveness was assessed using a similar metric.
When appropriate, weighting was applied to account for certain sampling errors in the data and to approximate having drawn an “even” number of a given dependent measure/demographic group. When directly comparing males and females, female data were given a weight of 1.1282. In comparing generations, baby boomers were weighted at 7.7738 and members of Generation X at 2.5212. A similar procedure was applied when comparing the behaviors of groups by income, geographical area, and educational attainment.
These data were collected via a self-reported survey built on Survey Monkey and hosted on Amazon’s Mechanical Turk. Self-report data are often limited in their accuracy by a variety of issues, such as respondents’ tendencies to minimize, exaggerate, misremember, or attempt to answer questions according to their own perceptions of societal biases.
Sources
- https://www.chicagotribune.com/2017/05/28/as-road-rage-rises-experts-give-reasons-for-behavior-tips-for-staying-cool/
- https://www.cbsnews.com/news/study-road-rage-incidents-involving-guns-are-increasing/
- https://www.usatoday.com/story/news/2017/02/15/millennial-drivers-highway-hazards-survey-shows/97888336/
- https://www.trafficsafetystore.com/blog/who-causes-accidents/
- https://www.psychologytoday.com/us/blog/in-one-lifespan/201211/openness-experience-and-intellectual-ability
- https://sloanreview.mit.edu/article/how-to-become-a-better-leader/
- https://www.psychologytoday.com/us/blog/fulfillment-any-age/201804/neuroticism-s-newest-twist-shows-what-s-behind-your-anxiety
- https://www.verywellmind.com/the-big-five-personality-dimensions-2795422
- https://finance.yahoo.com/news/5-car-insurance-myths-costing-130233133.html
Fair Use Statement
If you are interested in this work, you can help us improve public awareness of road rage issues by sharing the results of our survey on your website, social media accounts, or elsewhere as long as it’s for noncommercial purposes. Please do include a link back to this study if you do choose to share so that our team is properly credited for their work.