We set out to study 27 years of data about medical malpractice claims and other adverse actions leveled against health care professionals, utilizing information from the U.S. Health Resources and Services Administration. Our findings reveal which doctors, nurses, and other care providers face charges of incompetence most often and the typical outcomes of their cases. Additionally, we examined geographical contrasts in claims made by patients, showing which states produce the most suits. Whether you’re a health care professional or a current plaintiff, you won’t want to miss what we found regarding the evolving nature of malpractice allegations in America.
Malpractice Payouts: A Countrywide Chronology
Our analysis of payments resulting from malpractice claims between 1990 and 2017 reveals both national trends and interesting developments in particular areas. Broadly speaking, the most striking historical trend is a substantial decline in payouts since the early to mid-1990s, when average financial compensation exceeded $2 million per action in many states. This trend may relate to the gradual tort reform across the country. Between the 1980s and 2000s, many states adopted regulations designed to limit practitioners’ financial liability in malpractice suits, because doctors’ professional insurance premiums had surged significantly during the era of big payouts.
Throughout the years studied, however, some places seemed to compensate plaintiffs particularly well. Between 1990 and 2017, New York and Pennsylvania consistently neared the top of rankings, and payouts tended to be relatively high across the Northeast. Other states have emerged as regional outliers in recent years: Since the mid-2000s, Illinois and Georgia have typically witnessed larger payouts than neighboring states. Additionally, average payouts changed dramatically from year to year in some places. In 2011, the average payout in Washington, D.C., was over $700,000. The following year, it was less than $90,000.
Consequences Outside of Court
In addition to litigation, health care professionals contend with a range of professional sanctions for providing poor care, such as having their license to practice revoked by state medical boards. In recent years, these so-called adverse actions have been scrutinized for their limited impact: In many cases, doctors censured in one state can simply gain a license to practice in another. Regardless, these actions have become increasingly prevalent in recent decades, especially in some states. In 1990, for example, Ohio recorded just 94 adverse actions in total. In 2017, the state had over 2,677. In Pennsylvania, a similar surge took place during this period.
Understandably, some of the nation’s most populous states had the largest adverse action totals over time. Indeed, doctors flock to states such as New York, California, and Texas upon graduation from medical school. But other places had concerningly high rates of adverse actions per 100,000 residents, such as Vermont in New England and Oklahoma and Mississippi in the South. These findings could indicate one of two opposing realities: concerningly poor medical services, or exceptionally high standards of care that weed out incompetent practitioners. Vermont, for example, is widely considered to possess admirable medical resources, whereas Mississippi’s health care system has consistently struggled.

Adverse Actions: Ethics and Error
Once again, we find the largest adverse action totals in the most populous states: Texas outpaced all others in actions involving licensure and DEA enforcement, whereas California had the greatest number of actions against clinical privileges overall. But from a per-capita perspective, many smaller Southern states had alarmingly high rates of adverse actions involving licensure and DEA interventions. In Mississippi, the top-ranked state for DEA actions per capita, dozens of health care professionals have lost their prescribing abilities in recent years due to opioid overprescribing. In second-ranked Kentucky, doctors who prescribe opioids fear being targeted by DEA agents – and even being arrested.
The states with the highest rates of adverse actions against clinical privileges were more geographically diverse: Connecticut, Nevada, Washington, D.C., and Alaska filled out the top four spots. Interestingly, professional organizations such as the American Medical Association have recently taken issue with how such cases are recorded. According to these groups, physicians sometimes surrender their privileges for legitimate reasons (such as taking time off after having a child) and do not know they are under investigation at the time. Under current regulations, such cases must be reported to federal agencies, potentially hurting a doctor’s career prospects later.

Punishment by Profession
Registered nurses accounted for more than a quarter of all adverse actions against health care professionals, and practical nurses were the subjects of another 13 percent. Conversely, doctors (bearing the credential “M.D.”) were the subject of just 16 percent of all adverse actions. These findings certainly reflect the size of each profession, however: America is home to over 3,381,000 registered nurses and more than 820,000 practical nurses. Conversely, there are fewer than 1 million actively practicing physicians nationwide.
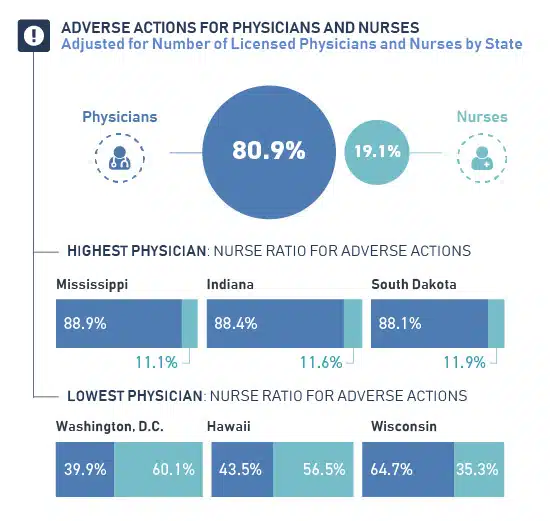
Accordingly, when we calculated the relative proportion of adverse actions to each profession, actions against doctors outnumbered the actions against nurses roughly 4-to-1. Indeed, negative surgery outcomes are a leading cause of malpractice allegations, and nurses typically avoid that liability altogether. In some places, however, nurses face a particularly difficult climate. In Hawaii and Washington, D.C., often described as some of the most difficult locations to practice nursing across the country, nurses were far more likely to be subject to adverse actions. Conversely, nurses were the least likely to face complaints in Mississippi, Indiana, and South Dakota.
Opioid Accountability?
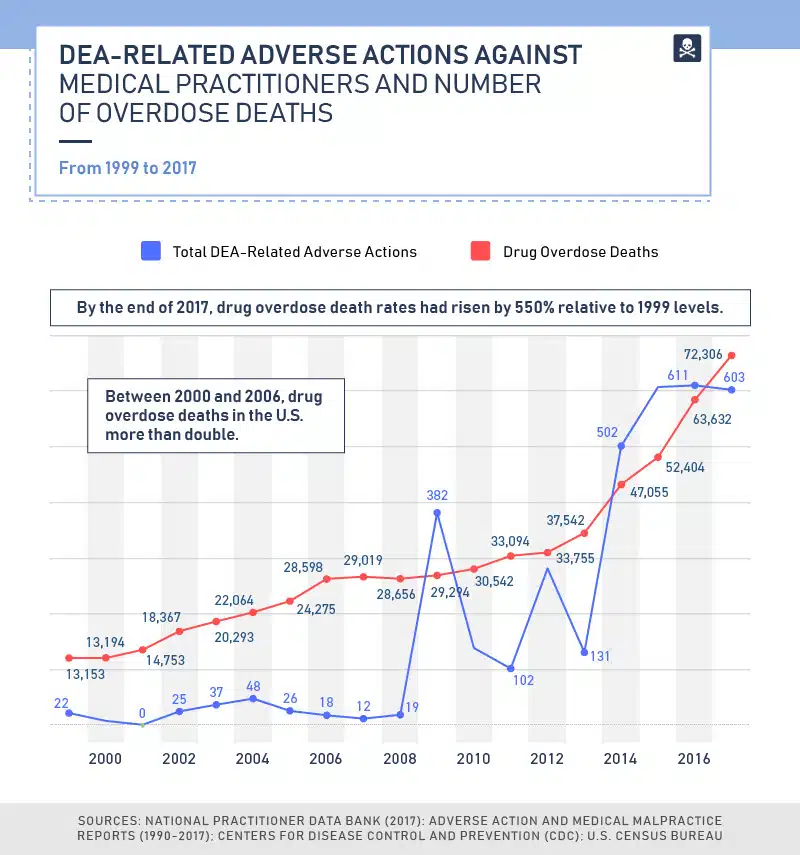
As the opioid crisis continues to claim thousands of American lives, has the DEA increased its enforcement efforts against physicians who prescribe addictive substances too liberally? In recent years, the agency’s efforts have yielded a greater number of adverse actions, with a particular spike in enforcement activity after 2013. But that swift uptick may have come too late in many respects: Experts point out that the prescribing of opioids peaked in 2011 and 2012, and many users have since moved on to illicit drugs instead. Moreover, the flow of opioids across America had been ratcheting up for decades prior. Between 1993 and 2015, for example, the production of oxycodone underwent a 39-fold increase.
In certain years, specific states saw a surge in enforcement activity due to local prescribing issues. Florida, for example, had 40 adverse actions relating to the DEA in 2012, likely as a part of an effort to disrupt “pill mill” operations across the state. Yet, actions against medical providers actually declined slightly across the country in 2017, despite a disturbing rise in overdose deaths that year. This may reflect a shift in the agency’s emphasis in recent months, moving from targeting individual practitioners to controlling supply and distribution on a larger scale.
Suits in the Sunshine State
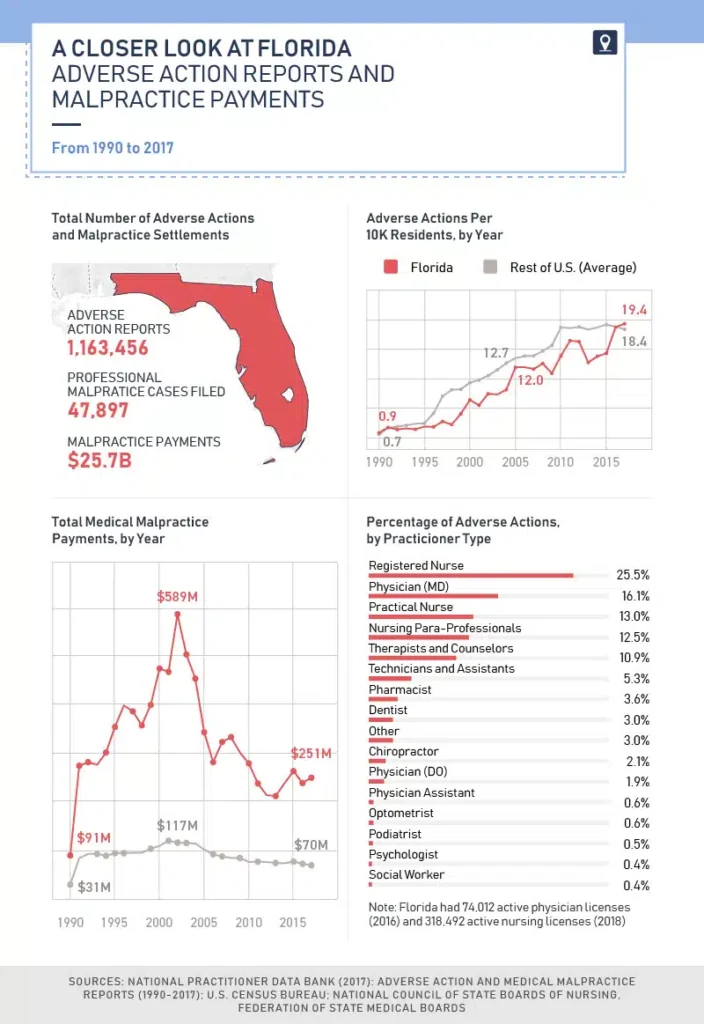
Because our team of legal experts practices in Florida and Georgia, we determined to study data from those states specifically. In Florida, annual malpractice payments far exceeded the national average between 1990 and 2017, amounting to $25.7 billion over that period. Interestingly, annual malpractice payouts climbed between 1990 and 2002, when they reached a massive $589 million. That year, a governor’s task force found that payouts were driving up insurance premiums for doctors and causing insurers to leave the state. Subsequently, the state legislature implemented a cap on noneconomic damages in medical malpractice cases, causing total payouts to fall precipitously.
Between 1992 and 2016, Florida typically had fewer adverse actions against medical professionals than the national average, and its professional malpractice cases were relatively low. However, this relatively low number of cases could change as a result of a 2017 state supreme court decision that struck down the cap on medical malpractice damages – much to the chagrin of those who fear the decision will lead to fraud and abuse.
Payouts in the Peach State
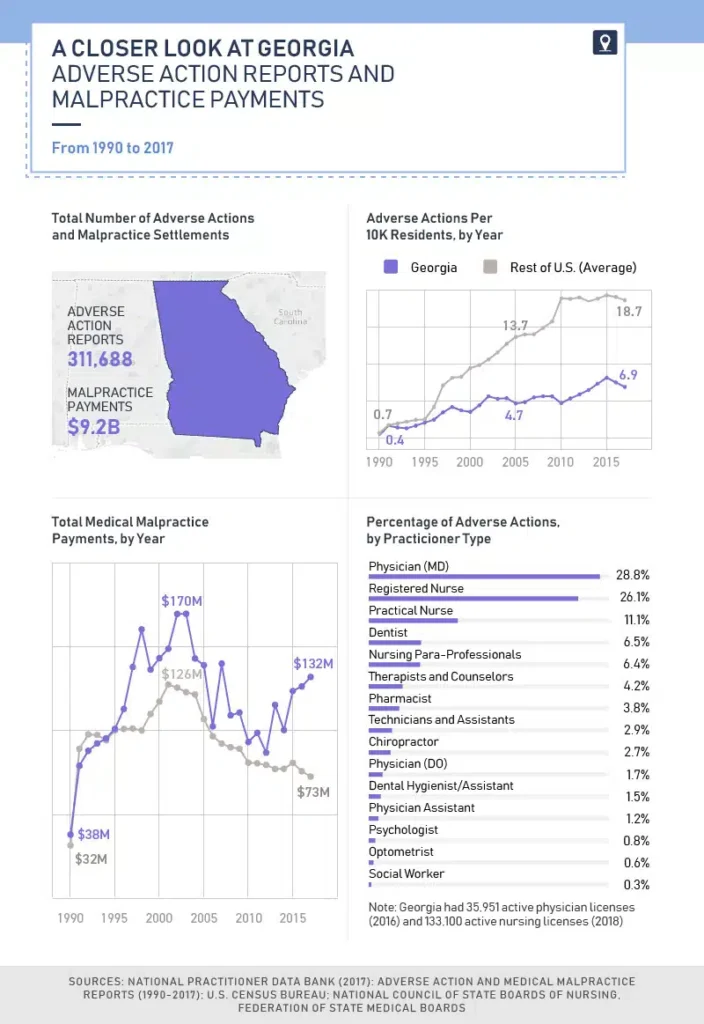
Somewhat like Florida, Georgia’s annual malpractice payouts were above the national average every year save for a few. Unlike its Southern neighbor, however, Georgia had per-capita rates of adverse actions far below the national average between 1996 and 2017. This finding could reflect the state’s investigative process for complaints against physicians, which critics have called cumbersome and flawed. If a doctor’s license expires during an investigation, for example, the state medical board can’t revoke it – meaning that physicians can escape any record of wrongdoing and apply for a license to practice medicine elsewhere.
Interestingly, physicians accounted for 29 percent of adverse actions, whereas registered nurses were the subjects of just 26 percent. Additionally, dentists were targeted in 7 percent of adverse actions, despite public complaints about the loose approach of the Georgia dental board. One 2018 investigation found that the board revoked less than one license per year on average and allowed dentists multiple chances to continue to practice after seriously harming patients.
Expertise in Your Area: Local Factors Matter
Our findings suggest significant historical variation in malpractice suit outcomes and other adverse actions: While financial judgments have declined in recent decades, health care providers now face professional censure far more frequently. Moreover, geographical differences are impossible to ignore, with particular states witnessing a disproportionate number of suits and professional complaints. Cumulatively, these findings indicate that the legal landscape is continually evolving. Medical litigation and its outcomes reflect a complex mix of local and chronological factors in addition to the facts of each case.
Our conclusions confirm what legal experts know already: Should you find yourself considering legal action against a health care provider, consult with a Florida medical malpractice attorney or Georgia medical malpractice attorney with deep experience in malpractice litigation in your local area. At Farah & Farah, our team of legal professionals provides expert counsel to residents of Florida and Georgia, drawing from our long track record of excellent service in these states. To learn more about our practice specialties and unparalleled dedication to our clients, explore our site today. If you’re ever hurt by the error of a medical professional, we’re ready to seek the justice you deserve.
Methodology
All data on adverse action and malpractice claims were generated using the Data Analysis Tool provided by the National Practitioner Data Bank, which is hosted by the U.S. Health Resources and Services Administration. Population data (for per-capita measures) were taken from the 1990, 2000, and 2010 U.S. censuses, and population for the intervening years was taken from U.S. census data. Fatal drug overdose data were obtained from the Centers for Disease Control and Prevention (CDC). All dollar amounts are adjusted for inflation.
Sources
- https://www.insurancejournal.com/news/national/2018/03/07/482609.htm
- https://www.cnbc.com/2018/02/22/medical-errors-third-leading-cause-of-death-in-america.html
- https://www.npdb.hrsa.gov/analysistool/
- https://www.npdb.hrsa.gov/hcorg/whatYouMustReportToTheDataBank.jsp#reportableActions
- https://projects.jsonline.com/news/2018/2/28/is-your-doctor-banned-from-practicing-in-other-states.html
- https://www.statnews.com/2017/11/09/doctors-medical-residents-retention-rural/
- https://www.modernhealthcare.com/article/20180220/NEWS/180229989/physicians-decry-consequences-of-consolidation
- https://www.clarionledger.com/story/news/local/2017/05/17/nurse-practitioners-charged-doctors-surrender-licenses-prescription-drug-investigation/328394001/
- https://www.courier-journal.com/story/news/crime/2018/08/02/kentucky-doctors-fear-arrest-treating-pain-opioids-amid-clinic-raids/863407002/
- https://www.kff.org/other/state-indicator/total-active-physicians/?currentTimeframe=0&sortModel=%7B%22colId%22:%22Location%22,%22sort%22:%22asc%22%7D
- https://wallethub.com/edu/best-states-for-nurses/4041
- https://www.statnews.com/2017/12/18/prescription-drug-supply-dea/
- https://www.durbin.senate.gov/newsroom/press-releases/durbin-senators-urge-dea-to-lower-opioid-quotas-to-combat-prescription-drug-abuse
- https://heroin.palmbeachpost.com/how-florida-spread-oxycodone-across-america/
- https://www.dea.gov/press-releases/2018/08/16/justice-department-dea-propose-significant-opioid-manufacturing-reduction
- https://www.dea.gov/press-releases/2018/02/14/dea-creates-new-resource-help-distributors-avoid-oversupplying-opioids
- https://www.orlandosentinel.com/2017/07/17/florida-supreme-court-crowns-itself-fact-finder-and-policymaker-on-malpractice/
- https://www.insurancejournal.com/news/southeast/2018/03/13/483042.htm
- https://www.ajc.com/politics/
- https://www.ajc.com/news/state–regional/dental-board-inaction-could-leave-patients-risk/euKRX5J0ejm5Yt0WxgQBeO/
Fair Use Statement
If you found this content informative, we invite you to share it with others who may feel the same. So long as you use them for noncommercial purposes, our information and graphics are yours for the taking. When you do, please link back to this page. No threats of legal action here, just a friendly request that you give us credit.