We’ve taken a look at some of the most popular recreational activities and explored all the different ways in which simply having a little bit of fun can result in injury and a visit to the ER. Jet skis, mopeds, scooters, ATVs … there are reasons your parents warned you about riding these types of vehicles when you were a kid. According to NEISS data, thousands of people go to the ER each year for various injuries involving motorized and non-motorized recreational vehicles and related equipment and apparel.
With kids and young adults being the main target audience for many of these motorized and non-motorized recreational vehicle companies, it’s important to be aware of the dangers these products present, including which result in the most hospital visits and which have been known to catch fire.
Summertime Woes
Not only is there a correlation between age and recreational activity-related injuries that cause people to go to the ER, but the time of year plays a role as well.
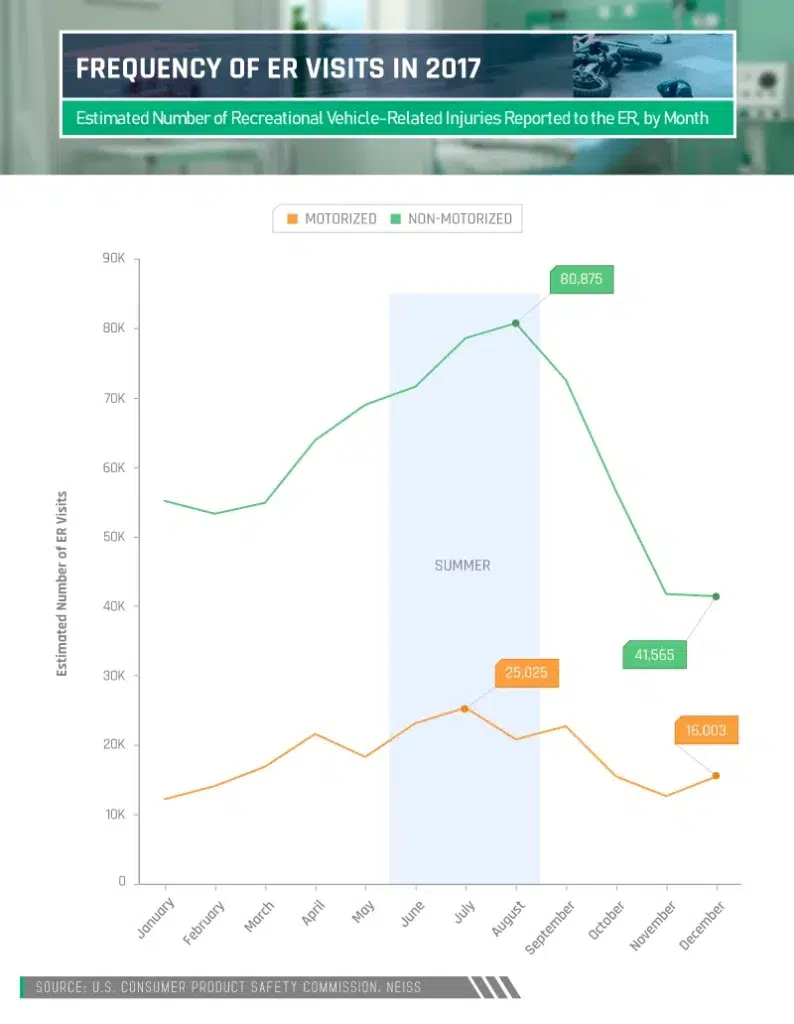
Warmer temperatures may bring relief for those in cooler climates, but increased sunshine and outdoor activities for most Americans also seem to bring more trauma. When examining emergency room visits during 2017, we found that those resulting from an injury due to motorized and non-motorized recreational vehicles peaked during the summer months.

Top Periods of Pain
There are a lot of factors that play into the reasons most ER visits occur during the summertime. Kids are out of school, which means there is plenty more time for activities like swimming, fishing, and riding bikes. Kids are much more prone to get hurt in the summertime due to the potential accidents that can occur from any of these activities. June and July saw peaks in injuries from things like golf carts and go-carts, ATVs, and other motorized vehicles, while bicycles and skateboards were likely to blame for accidents in August.
To Hospitalize or Not to Hospitalize
Not all ER visits turn into hospital stays. You could very well be on your way home after you’ve been treated in the emergency room with no need to prolong your visit. As of 2017, there have been roughly 137 million ER visits (39 million of which were injury-related), but only 12.3 million of them have resulted in hospital admission.
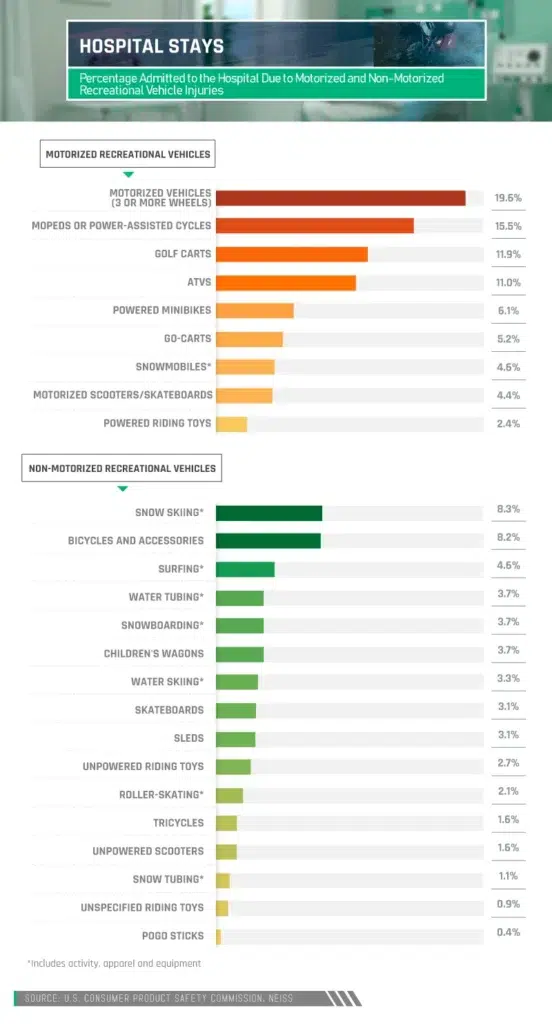
Of those hospital stays, motorized vehicles with three or more wheels were the biggest culprit (nearly 20 percent) and mopeds were not far behind (15.5 percent). When it came to non-motorized recreational items, snow skiing caused the most hospitalizations at 8.3 percent and bicycles almost tied at 8.2 percent.
And Your New Hospital Roommate Is ...
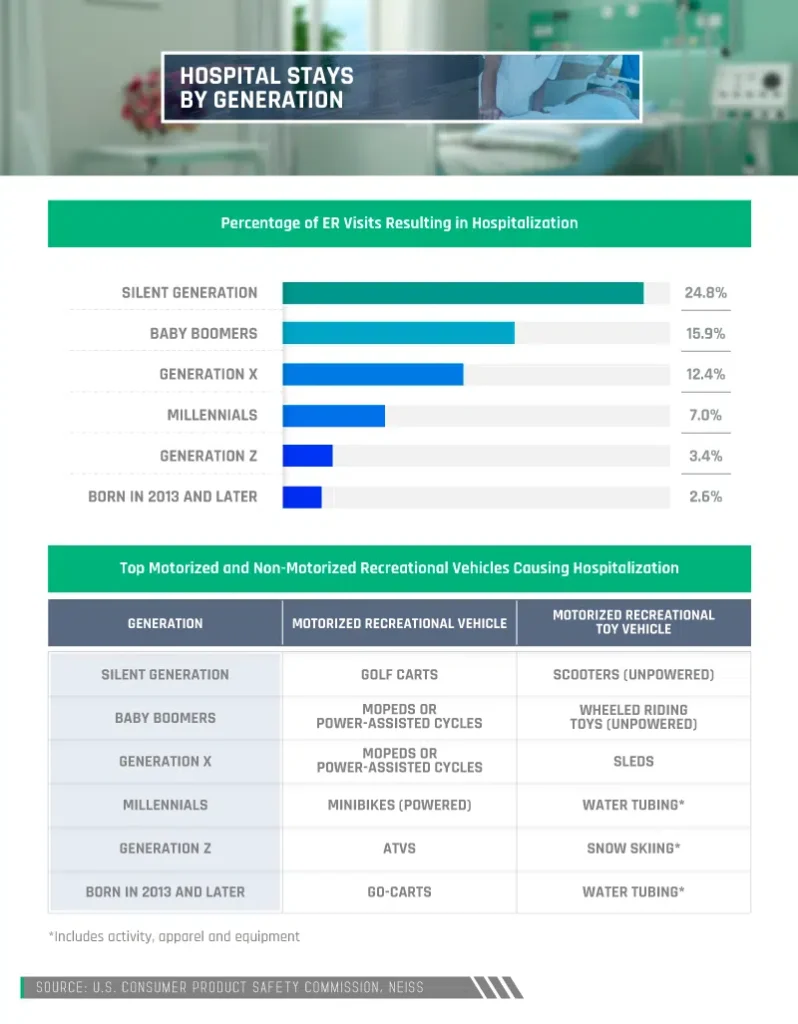
Different generations experience different kinds of injuries and reasons for visiting the ER. This also appears to be the case when it comes to which of these ER visits turn into hospital stays. The silent generation, those born between 1925 and 1945, were hospitalized the most – 24.8 percent of all ER visits – which is one and a half times more than other generations.
Golf carts were the motorized recreational vehicle that caused the most hospitalizations for the silent generation. Golf is loved and frequently played by older generations for many reasons. Baby boomers were next in line for the most hospitalizations at 15.9 percent, with mopeds and power-assisted cycles causing the most ER visits.
Buckle Up and Beware
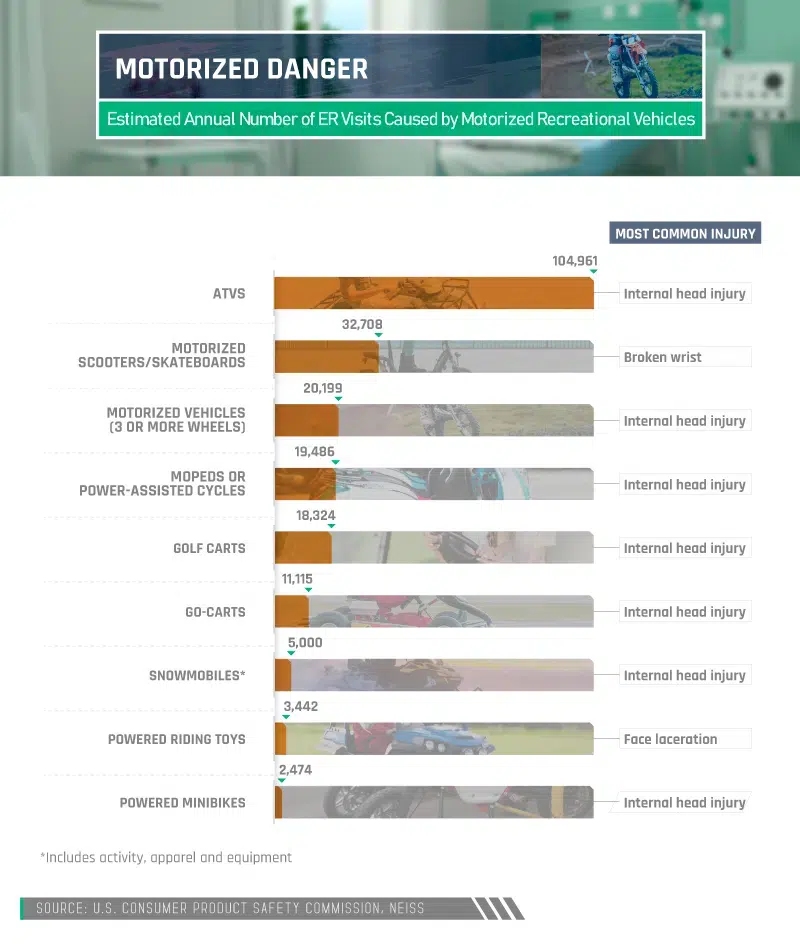
A large majority of recreation-related visits to the ER were caused by motorized vehicles. ATVs proved to be the most dangerous, causing 104,961 visits in 2017 – that’s three times more than any other recreational vehicle. Motorized scooters and skateboards came in second, causing 32,708 visits.
The types of injuries for which people came to the ER vary, but an internal head injury was the most dominant across the board. In 7 out of the 9 categories of recreational vehicles studied, injuries of this type were the most common. There are many preventative measures people can take when riding recreational vehicles to avoid such drastic injuries, including wearing a helmet. The American Society for Testing and Materials (ASTM) sets very strict standards for testing helmets for many sports and encourages people to wear headgear during various activities, including when using powered recreational vehicles, skateboards, and scooters.
Playtime Fouls
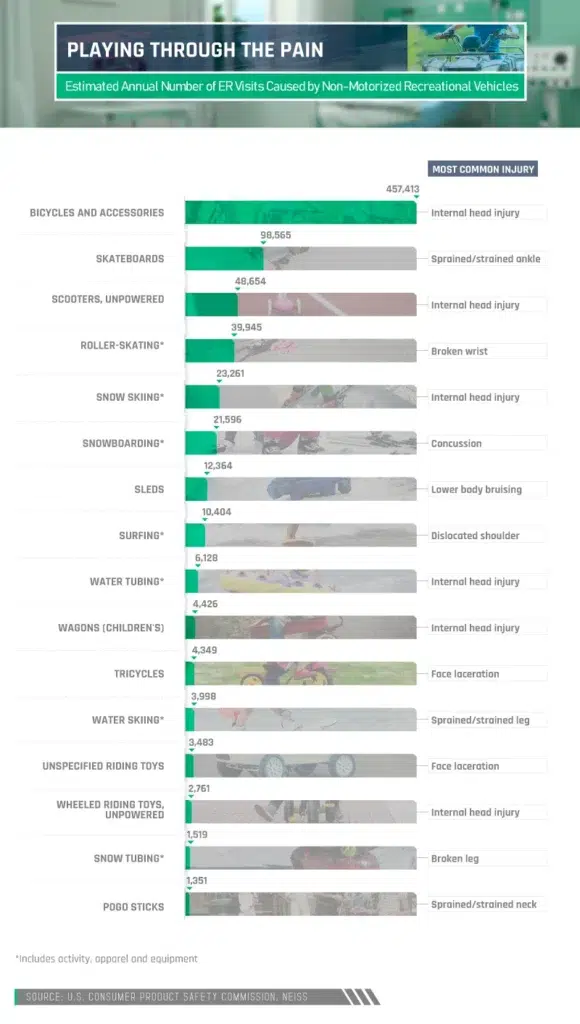
When it comes to non-motorized recreational vehicles, the vast majority of injuries sustained that resulted in an ER visit came from something that just about every child learns how to ride at a young age: a bike. Bicycles and their accessories caused 457,413 ER visits in 2017, which was four times more than any other non-motorized recreational vehicle studied. We looked at things like unpowered skateboards and scooters, roller skates, skis, and snowboards, none of which even came close to the amount of visits bikes caused.
According to research conducted from 2006 to 2015, more than 2.2 million children aged 5 to 17 were treated in the ER because of a bicycle-related injury – that’s 608 cases per day, or 25 cases every single hour. Again, helmet safety is increasingly important, as is being aware of your surroundings and simply practicing caution.
The Gender Debate
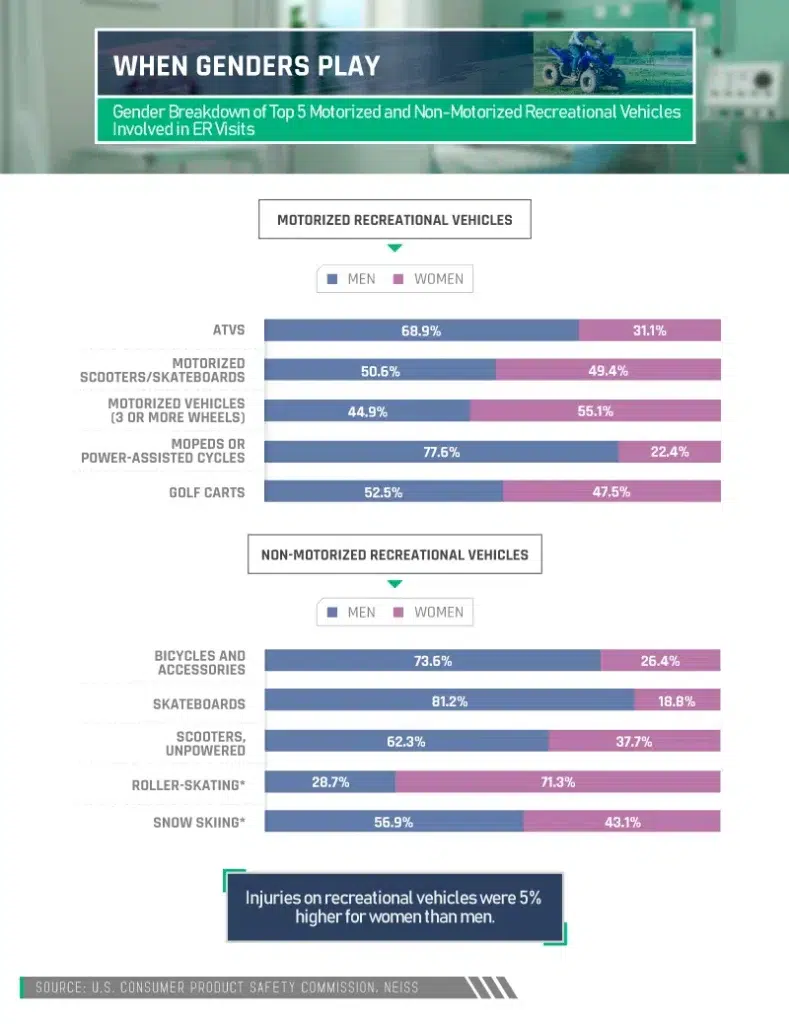
The gender debate continues … Who is more accident-prone when it comes to recreational vehicles? Women outweighed men when it came to visits to the ER due to injuries from roller-skating by a landslide – 71.3 percent versus 28.7 percent. There have also been more women in the ER because of three-wheeled motorized vehicle injuries as well, although not by much – 55.1 percent versus 44.9 percent. However, far more men than women have been admitted into the ER because of injuries from ATVs (68.9 percent), mopeds (77.6 percent), and skateboards (81.2 percent). Individual hobbies and interests could be an indicator as to why there is a huge difference in the number of men and women who visit the ER because of these particular recreation-related injuries.
Sticks and Stones May Break My Bones...
As we learned from the above chart, there are a lot of different kinds of injuries that can be caused by seemingly harmless recreational activities. Someone’s favorite outdoor activity could prove to be detrimental to their health and well-being, resulting in injuries that could keep them from ever participating in that particular activity again.
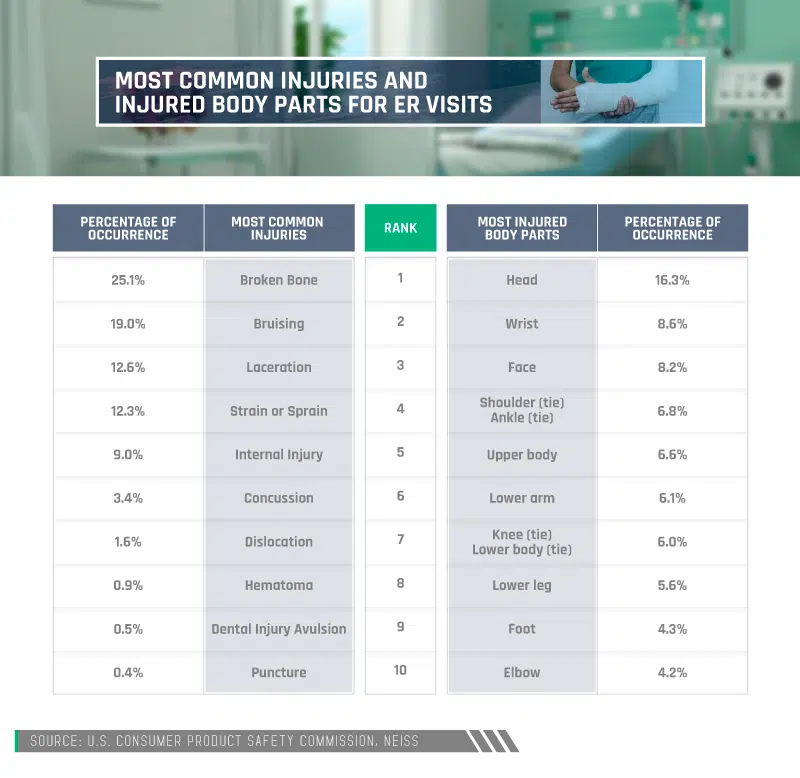
We took a look at the most common injuries sustained through recreational activities, as well as which body parts were injured most often. As one may suspect, broken bones happened the most often, at 25.1 percent, with bruising close behind at 19 percent. As far as the body part most prone to injury, the head stuck out at 15.4 percent.
Injuries Sustained
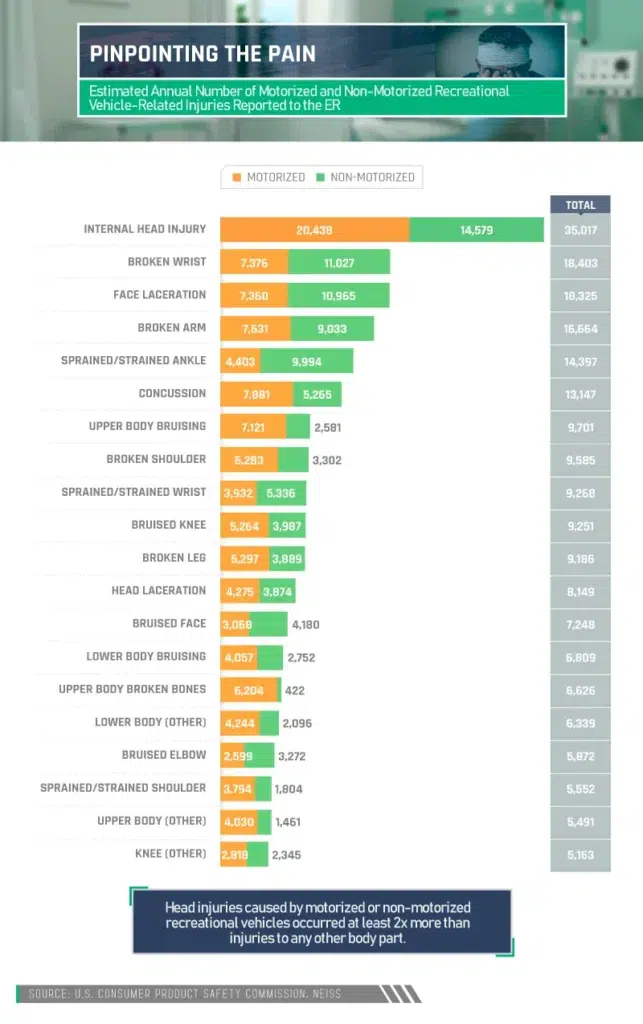
Emergency room personnel see patients with so many different kinds of injuries, caused by so many different kinds of variables. An estimated 3.2 million of these ER patients are children aged 5 to 14 who have sustained injuries due to recreational activities, including sports. Injuries included things like broken bones and bruising, but the most commonly injured part of the body was the head – 35,017 internal head injuries, to be exact – at least two times more than injuries to any other body part.
Broken wrists came in second, with 18,403 injuries sustained, followed closely by face lacerations, broken arms and sprained or strained ankles. Motorized recreational vehicles were the cause of more injuries than non-motorized ones in just about every category. The injuries caused more by non-motorized recreational vehicles included sprained or strained wrists and shoulders and bruising to the face and elbows.
The Generation Gap
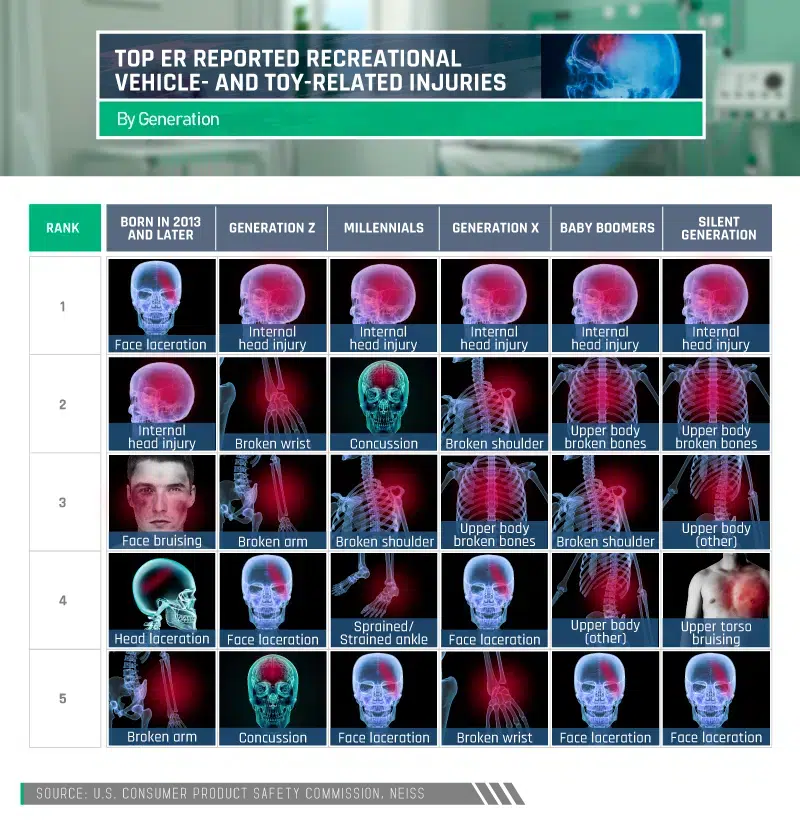
Recreational activities can be enjoyed in every stage of life, whether it’s a 5-year-old learning to ride a bicycle, a 10-year-old playing Little League, a college student shooting hoops with friends on the weekend, or an adult joining a community kickball league. The fun doesn’t stop with age –and neither do the injuries. But which generation gets hurt the most, and from what? Internal head injuries were the top for most age groups, except for children born in 2013 or later. This is in line with the rest of our study, which has consistently shown trauma to the head as the most commonly seen injury sustained through recreational activity that has landed people in the ER.
For children born in 2013 or later, the most reported injury was face lacerations. For a child of this age, supervision is crucial while they are playing with toys. If no one is watching them, the risk of harm is exponential, whether because of the vehicle itself or just simply the child being too young to understand how to play with it properly.
Alternatively, face lacerations were not as prevalent for older generations, who – because of the wisdom that may come with age and experience – might have more sense to protect their eyes, ears, nose, and mouth.
Proceed With Caution
As we can see, recreational activities, especially when driving or riding is involved, are not something to be taken lightly. What seems to be harmless on the surface can actually cause extreme harm to the body and result in ER visits and hospitalizations. No one wants to be told they can no longer hop on the back of a motorcycle, participate in a bike race, skateboard with their friends, or go on ski trips due to an injury. When participating in recreational activities such as those discussed above, it’s important to be well-versed in safety precautions and be aware that an accident can occur at any moment.
In the event that one does occur, you need to have a good personal injury attorney at hand to fight for your rights and help get the compensation you deserve. If you’ve been involved in an accident caused by a recreational vehicle, contact Farah & Farah today to schedule a consultation and let one of their skilled personal injury attorneys evaluate your case.
Methodology
We collected 2017 data from the U.S. Consumer Product Safety Commission – NEISS (accessed November 2018). We analyzed just the following items, which were split into two categories: recreational motorized and non-motorized vehicles.
| Recreational Motorized Vehicles | Recreational Non-Motorized Vehicles |
|---|---|
| ATVs | BICYCLES AND ACCESSORIES |
| GO-CARTS | POGO STICKS |
| GOLF CARTS | RIDING TOYS, NOT SPECIFIED |
| MINIBIKES, POWERED | ROLLER-SKATING* |
| MOPEDS OR POWER-ASSISTED CYCLES | SCOOTERS, UNPOWERED |
| MOTORIZED VEHICLES, NEC (3 OR MORE WHEELS) | SKATEBOARDS |
| POWERED RIDING TOYS | SLEDS |
| SCOOTERS/SKATEBOARDS, POWERED | SNOW SKIING* |
| SNOWMOBILES (ACTIVITY, APPAREL, OR EQUIPMENT) | SNOWBOARDING* |
| SNOW TUBING* | |
| SURFING* | |
| TRICYCLES | |
| WAGONS (CHILDREN’S) | |
| WATER SKIING* | |
| WATER TUBING* | |
| WHEELED RIDING TOYS, UNPOWERED |
Using weighted values provided by the NEISS, we estimated the number of injuries per recreational vehicle (motorized and non-motorized). Similar items were grouped together, such as “Mountain and All-Terrain Bicycles and Accessories” and “Bicycles and Accessories.” Motorized and non-motorized recreational vehicles denoted with an asterisk include the activity, apparel, and equipment.
Limitations
The data compiled use a sampling system and are estimates, so figures may be inexact. Recreational vehicles (motorized and non-motorized) with less than 20 entries were excluded from the analysis, which included Dune Buggies/Beach Buggies and Pedal-Powered Adult Vehicles (3 or more wheels). No statistical testing was conducted on this data. Further research could be more in depth.
Sources
- https://www.medbroadcast.com/channel/fitness/overview/having-fun-is-good-for-you
- https://www.forbes.com/sites/dianahembree/2017/06/30/exploding-hoverboards-top-consumer-watchdog-blacklist-for-summer-toys/#4876294160d2
- https://www.washingtonpost.com/lifestyle/wellness/for-older-athletes-some-tools-to-measure-recovery-time/2018/01/16/95bada12-f55c-11e7-a9e3-ab18ce41436a_story.html?utm_term=.f30a3abd5de7
- https://www.cdc.gov/nchs/fastats/emergency-department.htm
- https://www.speeli.com/why-do-older-people-like-to-play-golf/
- https://www.brainline.org/article/head-injury-prevention-tips
- https://www.nationwidechildrens.org/newsroom/news-releases/2018/06/bike-injuries-study
Fair Use Statement
The public can benefit from knowing the potential dangers of recreational activities enjoyed on a regular basis. If you agree, please share this article for noncommercial purposes. Just be sure to link back to this page so that our authors receive proper credit.