Dread While Driving
Comparing Driving Fears to Actual FARS Data
As joyous as driving is, the tiniest mistake or moment of hesitation can be traumatizing for some motorists. In 2017, more than 40,000 people died in the U.S. as a result of automotive accidents.
Even strapping in for the shortest of rides can sometimes have catastrophic consequences. Whether you’re worried about other drivers paying attention when changing lanes, the impact of inclement weather on road conditions, or a semitruck’s tire exploding, you never know when an accident could be on the horizon.
But are these fears generated by newsreel highlights, or are the data there to support these fatal risks? To find out, we surveyed over 1,500 licensed drivers and compared their responses to data from the Fatality Analysis Reporting System (FARS). Read on as we explore the roads making drivers the most uncomfortable, the scariest driving conditions, and the states with some of the most hazardous driving scenarios.
True Roadway Risks
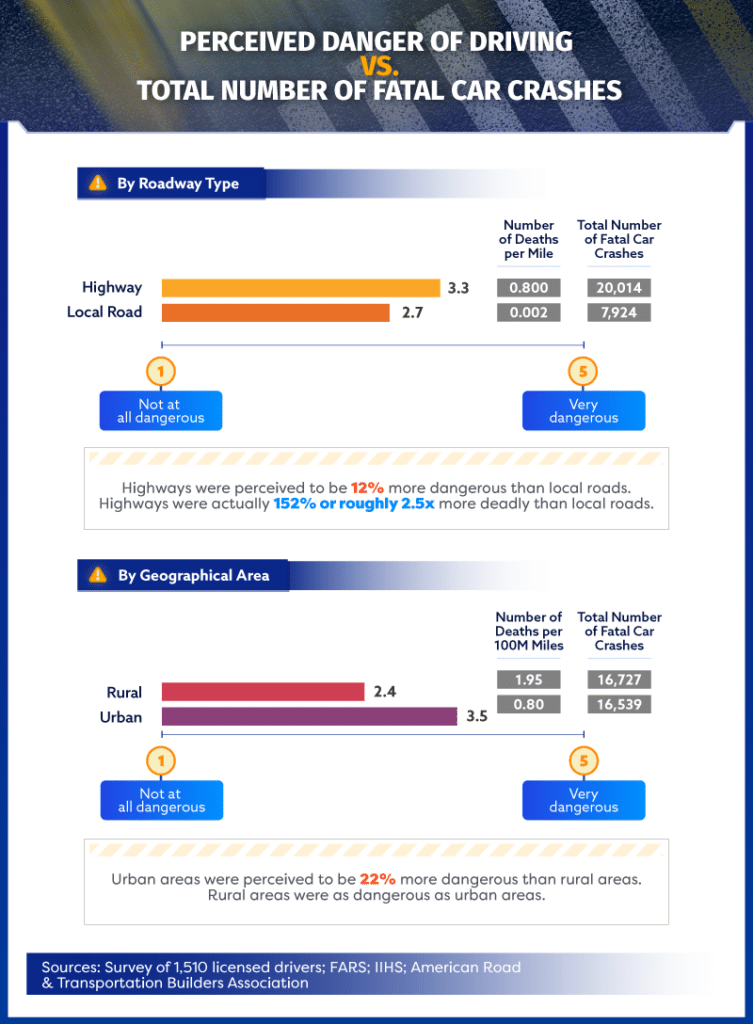
If life is indeed a highway, drivers are generally afraid of it – or at least more afraid of highways than local roads. On a scale of one to five, where one was not at all dangerous and five was very dangerous, the average perceived danger rating for highways was 3.3, compared to 2.7 for local roads.
While drivers were correct to perceive highways as dangerous, they still might underestimate the true risks associated with driving on this type of road. According to FARS, there were over 20,000 fatal car crashes in 2016 on highways – over 2.5 times more than the number recorded on local roads over the same period.
Given that fatal car crashes are on the rise, reaching a nine-year high in 2016, drivers in rural areas might hope their roads are safer than roadways in urban areas. However, there was almost an identical number of fatal car crashes recorded in both rural and urban areas in 2016.
Snowy Driving Dread
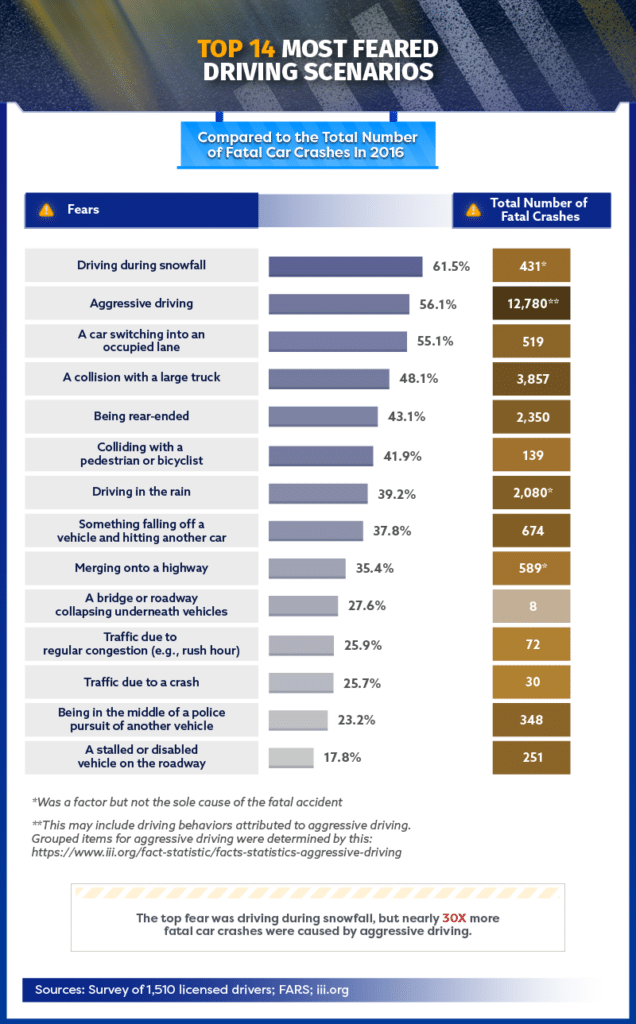
Some people may dream of a white Christmas, but it could be drivers’ biggest nightmare. Out of the over 1,500 individuals surveyed, over 61 percent indicated driving in snow was the most feared driving situation. While over 400 fatal car crashes were due, in part, to driving during snowfall, this fear was nowhere close to causing the most fatalities. It was aggressive adriving that led to the largest number of fatalities in 2016 at over 12,700 fatal car crashes.
A collision with a large truck – the fourth most feared driving scenario – resulted in the second-highest fatality total at nearly 3,900. Due to trucks weighing 20 to 30 times more, and riding higher on the road than typical passenger cars, smaller vehicles may be susceptible to underriding, or an accident where one car partially slides underneath another.
Dangerous Driving Across the U.S.
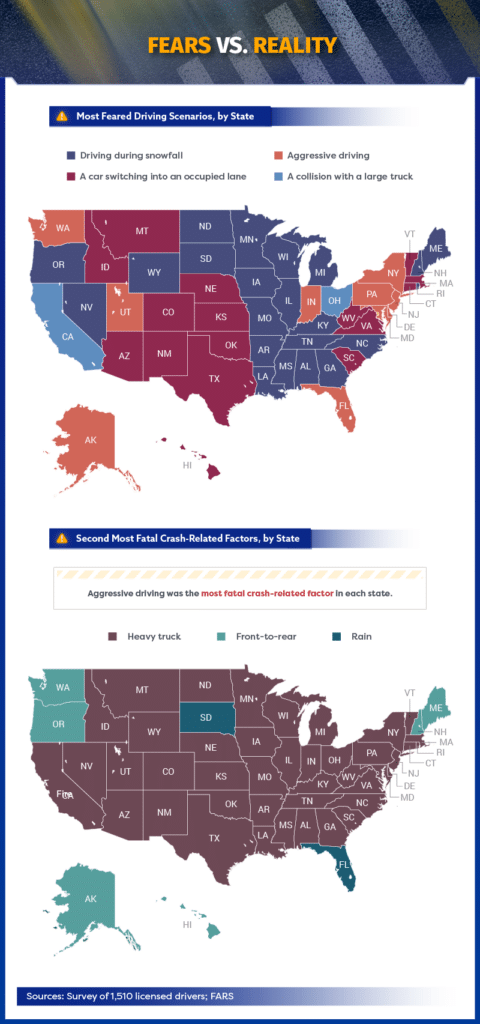
Drivers from many states including Alaska, Maryland, Pennsylvania, and Washington didn’t rate driving in snowfall as their biggest fear. Instead, it was the fear of aggressive drivers that kept them on high alert.
In fact, almost 80 percent of U.S. drivers engaged in at least one aggressive driving behavior in 2015. While there’s no single cause for how or why aggressive driving happens, experts seem to suggest that lower gas prices and more congested roadways are contributing factors. And even if another driver’s actions makes you flustered or upset, it’s important to recognize that acting on those behaviors, such as changing lanes too quickly or not being mindful of surrounding traffic, can have deadly consequences.
The second biggest source of crash-related fatalities across many of these states was collisions with large trucks. In most of these scenarios, it’s someone in a passenger vehicle, not in a large truck, who dies.
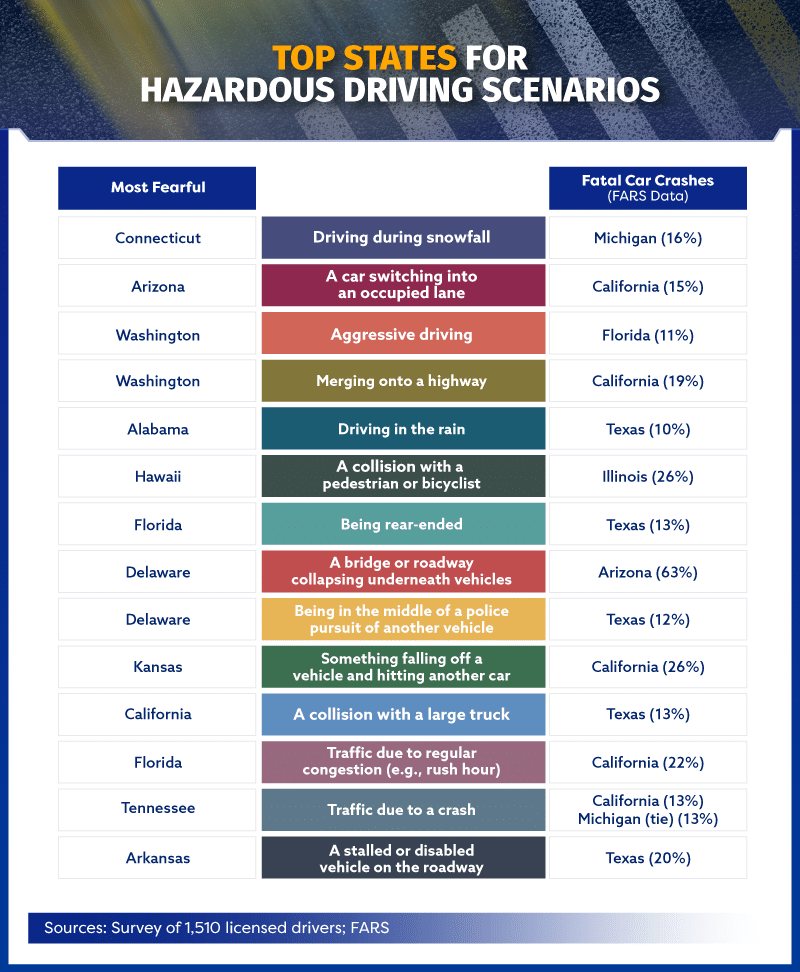
State of Dangerous Driving
There are plenty of common myths when it comes to driving safety, especially where hazardous roadways are concerned. Even though driving during snowfall was one of the biggest commuting fears across the country, many people still don’t know how often snow tires are necessary and may think underinflating tires will provide better traction during the winter months. In reality, this practice could be putting them in more danger. As we found, people may have similar misconceptions about which conditions are truly the biggest threats in their state.
The state that feared driving during snowfall the most was Connecticut, but this scenario led to the highest rate of fatal car crashes in Michigan (16 percent). And while it was residents from Alabama who were the most afraid of driving in the rain (one of the deadliest driving hazards in America), deadly rain-induced accidents were more common in Texas (10 percent) than anywhere else.
Similarly, California residents may not realize just how dangerous the routes in their state can be. While they were more afraid of collisions with large trucks, it’s other perils like things falling off vehicles (26 percent) and traffic due to regular congestion (22 percent) where they should be most vigilant.
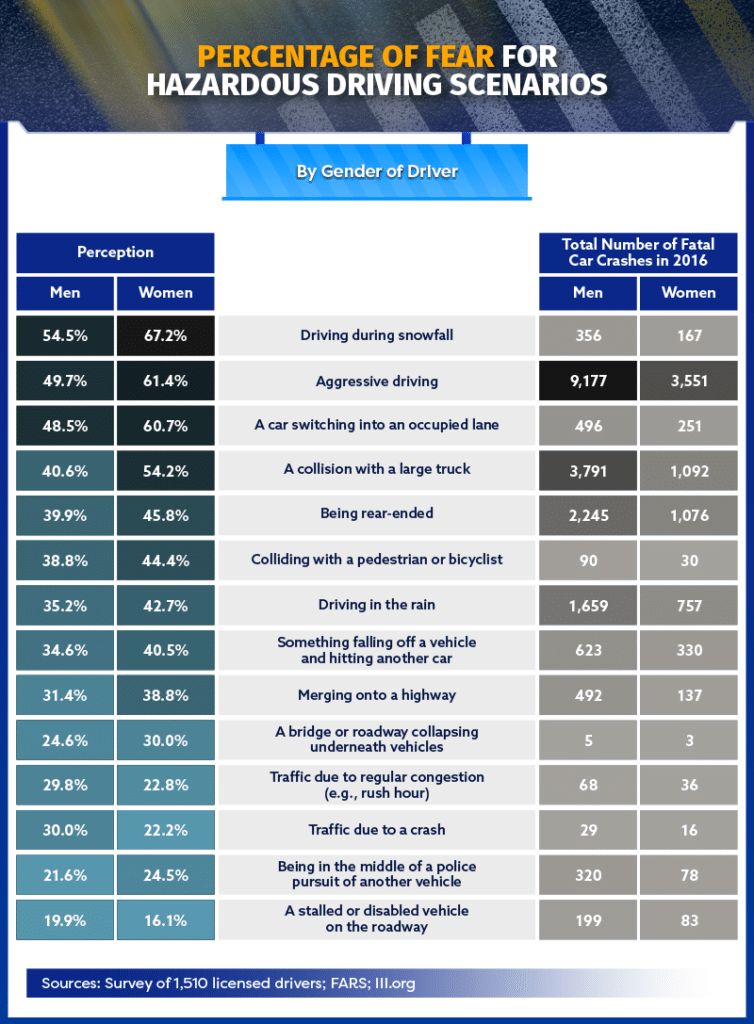
Perilous Driving Conditions
One of the most important elements of road safety is being able to quickly recognize a hazardous driving situation. Most collisions are referred to as accidents – and they can be just that – such as a momentary distraction or an unnoticed change in the roadway.
However, the driving scenarios people might be the most fearful of may not necessarily be the most dangerous. Driving during snowfall made both men (nearly 55 percent) and women (roughly 67 percent) the most uncomfortable. While driving during the winter months was considered the most feared driving condition, it wasn’t nearly as deadly as encountering an aggressive driver, switching lanes into occupied traffic, or colliding with a large truck. All of those scenarios killed more people than driving through snow.
While just 35 percent of men and nearly 43 percent of women were concerned about driving in the rain, this driving scenario was associated with more than 2,400 total fatal accidents in 2016. One of the easiest precautions you can take when driving in rain is slowing down and putting enough distance between you and the cars around you.
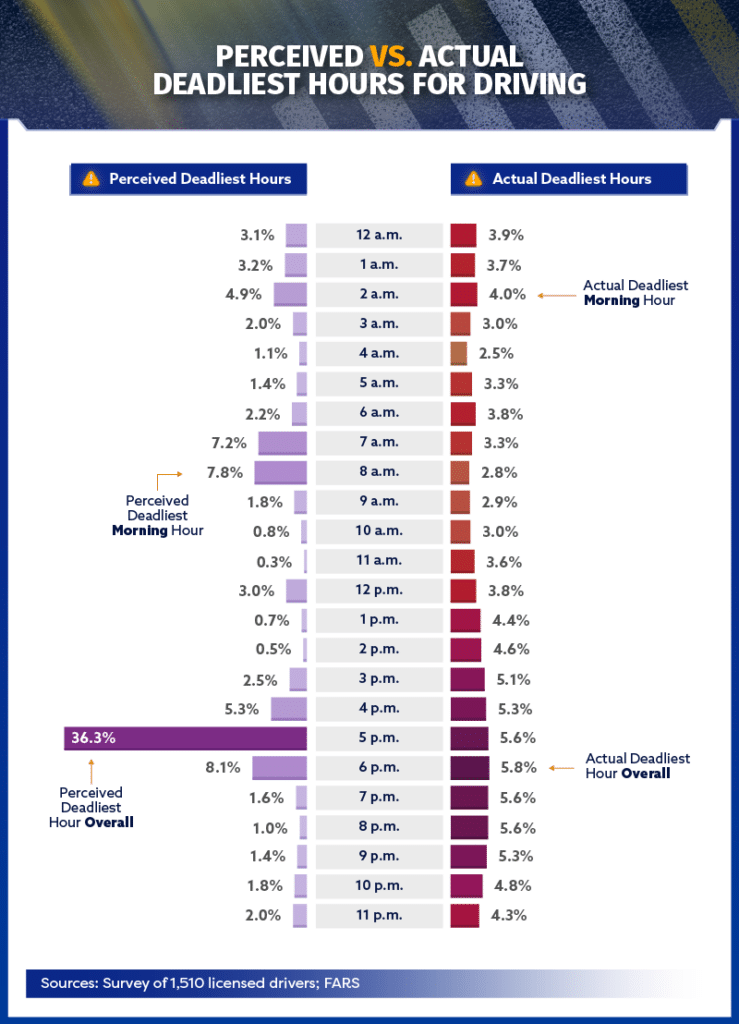
Bad Times to Drive
Drivers perceived the rush-hour commute home, between 5 p.m. and 5:59 p.m., as the deadliest hour to be on the road. Over 36 percent felt car accidents or collisions during this single hour were most likely to have fatal outcomes.
However, 6 p.m. to 6:59 p.m. was actually the deadliest hour, with just under 6 percent of all fatal car crashes taking place during this window.
Commute perceptions may also have an effect on drivers’ understanding of the deadliest morning hours. While almost 8 percent felt 8 a.m. was the deadliest morning hour, there was less than 3 percent of fatal car crashes recorded at this hour in 2016. Interestingly, 2 a.m. was the actual deadliest morning hour (4 percent of fatal car crashes).
For When Accidents Do Happen
No matter where you’re going or how far you’re driving, accidents can happen in the blink of an eye. And while you might be overly cautious in some hazardous driving conditions, sometimes the most feared driving scenarios are not actually the most fatal.
Driving in the snow can be dangerous, but it’s collisions with aggressive drivers, big trucks, front-to-end accidents, and driving in the rain you should usually be the most concerned about. And while it’s impossible to predict the conditions a car crash will happen under, it’s important to know what steps you should take if you do get into an accident.
Calling the police, moving your car from the flow of traffic, and taking photos of the damage are important first steps following a crash. For accidents large or small, exploring your options for appropriate legal representation can also be an essential step toward protecting your assets and getting back on the road quickly.
Methodology
We collected data from the NHTSA’s Fatality Analysis Reporting System (FARS), which collects information on fatal roadway accidents in America where a driver, passenger, or pedestrian is killed while a vehicle is involved. The most recent year of data (2016) is publicly available (reported as of July 2018). We also collected data from 1,510 licensed drivers via a survey. Participants ranged in age from 18 to 82 with a mean of 39 and a standard deviation of 11.
The sample sizes for states via the survey were:
| State | Sample size | State | Sample size |
|---|---|---|---|
| Alabama | 26 | Montana | 26 |
| Alaska | 26 | Nebraska | 26 |
| Arizona | 30 | Nevada | 27 |
| Arkansas | 26 | New Hampshire | 26 |
| California | 51 | New Jersey | 30 |
| Colorado | 26 | New Mexico | 26 |
| Connecticut | 27 | New York | 39 |
| Delaware | 26 | North Carolina | 38 |
| Florida | 68 | North Dakota | 22 |
| Georgia | 36 | Ohio | 36 |
| Hawaii | 26 | Oklahoma | 26 |
| Idaho | 26 | Oregon | 28 |
| Illinois | 35 | Pennsylvania | 39 |
| Indiana | 26 | Rhode Island | 26 |
| Iowa | 27 | South Carolina | 31 |
| Kansas | 27 | South Dakota | 26 |
| Kentucky | 31 | Tennessee | 33 |
| Louisiana | 30 | Texas | 53 |
| Maine | 26 | Utah | 26 |
| Maryland | 26 | Vermont | 26 |
| Massachusetts | 28 | Virginia | 29 |
| Michigan | 40 | Washington | 27 |
| Minnesota | 28 | West Virginia | 26 |
| Mississippi | 26 | Wisconsin | 26 |
| Missouri | 33 | Wyoming | 19 |
The sample sizes for North Dakota and Wyoming were 22 and 19, respectively. It is possible that with more participants from these states, we could have gained more insight into this population. For aggressive drivers, we grouped multiple behaviors that could be considered a form of aggressive driving such as road rage, careless driving, failure to obey an actual traffic sign, traffic control devices, or traffic officers, failure to obey safety zone traffic laws, failure to yield right-of-way, following improperly, improper lane usage, improper or erratic lane changing, intentional illegal driving on the road shoulder, in a ditch, on a sidewalk or on a median, making an improper entry to or exit from the trafficway, making another improper turn, operating a vehicle in an erratic, reckless, or negligent manner, passing where prohibited by posted signs, pavement markings, or a school bus displaying a warning not to pass, passing with insufficient distance or inadequate visibility or failing to yield to an overtaking vehicle, and traveling on prohibited trafficways. Making these choices was determined by the III’s “Facts + Statistics: Aggressive driving” article.
To examine pre-crash driver- and vehicle-level data, Option 3 must be used when querying the FARS database. This option allows users to determine the total number of fatal accidents where different “body type” vehicles are involved. When exploring this option, we determined that 34 fatal accidents were not accounted for in FARS Option 3 but were accounted for in FARS Option 1 and Option 2. For that reason, figures may be off by as much as 34 fatal accidents. Also, statistical testing was not conducted, so the claims listed above are based solely on means.
Sources
- https://www.usatoday.com/story/money/cars/2018/02/15/national-safety-council-traffic-deaths/340012002/
- https://www.usatoday.com/story/money/cars/2017/10/06/nhtsa-2016-deadly-crashes/739842001/
- https://www.washingtonpost.com/local/trafficandcommuting/new-study-suggests-more-anger-aggressive-behavior-among-us-drivers/2016/07/14/d03ee1fc-49f4-11e6-bdb9-701687974517_story.html?noredirect=on&utm_term=.006ed5702428
- https://www.iihs.org/topics/fatality-statistics/detail/large-trucks
- https://www.dmv.org/how-to-guides/hazardous-conditions.php
- https://exchange.aaa.com/safety/driving-advice/wet-weather-driving-tips/#.W5A4DuhKjIU
- https://money.usnews.com/money/personal-finance/articles/2018-07-03/7-steps-to-take-after-a-car-accident
Fair Use Statement
Want to help make the road a safer place? We’d love to see the results of this survey shared with your readers for any noncommercial use. Just ensure a link back to this page so that they can see our findings in their entirety and our contributors earn credit for their work.